Figure 5.
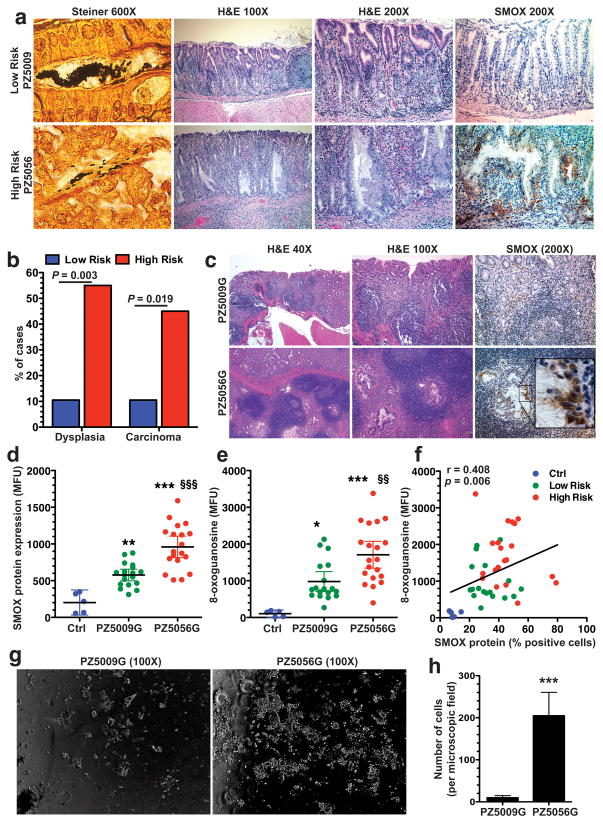
Increased oncogenic potential of H. pylori from the high risk region in the gerbil model. (a) Upper and lower panels: photomicrographs from gastric tissues from animals infected with low risk strain PZ5009 and high risk strain PZ5056, respectively. Left panels: Steiner (modified silver) staining of H. pylori. Middle panels: H&E staining, with hyperplasia and dysplastic glands shown for strain PZ5056. Right panels: SMOX immunohistochemical staining, with increase in dysplastic glands of PZ5056-infected gerbil. (b) Frequency of high grade dysplasia or carcinoma in gerbils infected with gerbil-adapted low risk (PZ5009G) and high risk (PZ5056G) strains. n = 19 and 20 gerbils were infected with PZ5009G and PZ5056G, respectively. (c) Left panel and middle panels: H&E staining of gerbil stomach tissues, showing invasive malignant-appearing glands with PZ5056G, and diffuse gastritis with both strains. Right panels: Staining for SMOX showing more intense staining in dysplastic glands with PZ5056G infection. (d–f) Flow cytometry performed on gastric epithelial cells isolated from stomach tissues. (d) SMOX protein levels. (e) 8-oxoguanosine levels. (f) Correlation (Spearman coefficient) between SMOX-positive cells and 8-oxoguanosine levels. (g) Brightfield photomicrographs of cells from soft agar assays of cells isolated from gerbils infected with strains PZ5009G and PZ5056G. (h) Summary data for number of cells counted in 6 fields at 100X. n = 4 gerbils were infected with each strain for 4 weeks and gastric epithelial cells were isolated and plated on three different soft agar coated plates per stomach. In d and e, **P < 0.01, ***P < 0.001 versus control (Ctrl); §§P < 0.01, §§§P < 0.001 versus PZ5009G. For h, ***P < 0.001 versus PZ5009G.

