
Fig. 4.
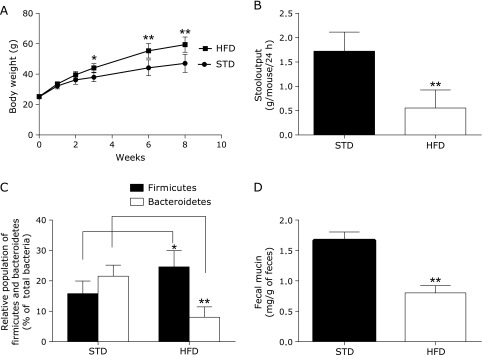
A: Time course of body weight in control mice and mice fed with high-fat diet (with induced obesity). B: Stool output from control mice and mice with high-fat diet-induced obesity. C: Relative population of Firmicutes and Bacteroidetes phyla to all bacteria. D: Fecal mucin contents of control mice and mice with high-fat diet-induced obesity. Fecal mucin content was determined using a fluorimetric assay that discriminates O-linked glycoproteins (mucins) from N-linked glycoproteins. STD: standard diet (n = 5); HFD: high-fat diet group (n = 5). *p<0.05, **p<0.01 vs STD.