Abstract
Background
Estimation of cardiovascular disease risk is increasingly used to inform decisions on interventions, such as the use of antihypertensives and statins, or to communicate the risks of smoking. Crude 10-year cardiovascular disease risk risks may not give a realistic view of the likely impact of an intervention over a lifetime and will underestimate of the risks of smoking. A validated model of survival to act as a decision aid in the consultation may help to address these problems. This study aims to describe the development of such a model for use with people free of cardiovascular disease and evaluates its accuracy against data from a United Kingdom cohort.
Methods
A Markov cycle tree evaluated using cohort simulation was developed utilizing Framingham estimates of cardiovascular risk, 1998 United Kingdom mortality data, the relative risk for smoking related non-cardiovascular disease risk and changes in systolic blood pressure and serum total cholesterol total cholesterol with age. The model's estimates of survival at 20 years for 1391 members of the Whickham survey cohort between the ages of 35 and 65 were compared with the observed survival at 20-year follow-up.
Results
The model estimate for survival was 75% and the observed survival was 75.4%. The correlation between estimated and observed survival was 0.933 over 39 subgroups of the cohort stratified by estimated survival, 0.992 for the seven 5-year age bands from 35 to 64, 0.936 for the ten 10 mmHg systolic blood pressure bands between 100 mmHg and 200 mmHg, and 0.693 for the fifteen 0.5 mmol/l total cholesterol bands between 3.0 and 10.0 mmol/l. The model significantly underestimated mortality in those people with a systolic blood pressure greater than or equal to 180 mmHg (p = 0.006).
The average gain in life expectancy from the elimination of cardiovascular disease risk as a cause of death was 4.0 years for all the 35 year-old men in the sample (n = 24), and 1.8 years for all the 35 year-old women in the sample (n = 32).
Conclusions
This model accurately estimates 20-year survival in subjects from the Whickham cohort with a systolic blood pressure below 180 mmHg.
Background
The evaluation of the risk of developing coronary heart disease (CHD) is increasingly used as a basis for making treatment decisions to prevent cardiovascular disease (CVD). Internationally, the most established measure is the Framingham risk [1] for developing CHD over a 10-year period [2-4]. Such measures also have some value as a means of communicating risk to individuals in consultations. This facilitates patient participation in treatment decisions and can help inform advice about the risks of smoking. However, there are weaknesses to this approach. A common approach is to use a 15% 10-year risk of CHD as a threshold for using antihypertensive drugs in people with a systolic BP between 140 and 160 mmHg [3,4]. However, there are weaknesses to using simple absolute CHD risk without consideration of other factors [5]. Cardiovascular risk increases with age and so the elderly more often cross this treatment threshold. Most other causes of death also increase with age and life expectancy reduces with age. Given that the benefits of treatment are accrued over time, younger patients with a lower risk of CHD, but a greater life expectancy might have more to gain from treatment. Also when communicating the risks of smoking, the CHD risk is an underestimate of the true risks of smoking because of the wide variety of other pathologies that it causes.
The 10-year Framingham CHD risk for an individual only gives a crude idea of the likely impact of treatment or smoking cessation on an individual's life as it does not take into account the impact of competing causes of death, in particular other significant causes of mortality related to smoking. Other Markov models have been developed to assess the impact of cardiovascular disease mortality [6] or to evaluate the cost-effectiveness of treatment [5], but most do not take into account the relative risks of non-cardiovascular death for smokers compared to non-smokers [7-10], or model survival in populations rather than individuals [11]. Grover et al developed a model based on the Lipid Research Clinics program which makes some adjustment for the relative risks of smoking [12]. It has been validated against a number of intervention trials showing that its predictions of survival correlate highly with the observed survival. A Markov cycle tree evaluated using cohort simulation was developed to estimate survival over a lifetime. The model uses the Framingham equations for calculating CVD risks. The model also takes into account non-cardiovascular competing causes of death and models the changes in CHD risk factors with age. A Markov cycle tree structure was used because of the complex variety of pathways between the starting 'well' state and the absorptive 'dead' state [13].
The model presented in this paper takes into account competing causes of death, changes in risk factors with age and the relative risks of smoking on non-CVD mortality. It can estimate the probability of survival (between 0.0 and 1.0) at annual increments from the start age to the age of 85. Before such a model could be used in clinical practice to inform treatment decisions, it is important that some measure of its predictive accuracy is obtained.
This study uses data from the Whickham study [14,15] to assess the accuracy of the model at predicting survival in this cohort at twenty years. The original Whickham study was conducted between 1972 and 1974 in a mixed urban and rural area close to Newcastle upon Tyne. The cohort included 2779 adults aged over the age of 18 years, randomly identified to generate a sample that closely matched the United Kingdom (UK) population in terms of age, gender and social class. The original data set included blood pressure (BP), electrocardiogram (ECG) and serum total cholesterol (TC), thus allowing its use for Framingham equations. A 20-year follow-up study was also conducted which collected further data on the incidence of thyroid disorders and also collected data on morbidity and mortality.
Methods
Absolute, annual non-CVD risk of death were derived by linear interpolation from the UK National mortality statistics for 1998 [16]. The risks for those causes of death that were smoking related were adjusted for smokers and non smokers using the relative risks from the 4-year follow-up of the US Cancer Society's 50-state study (CPS-II) quoted in the US Surgeon General's report of 1989 (Table 1) [17].
Table 1.
Smoking-related, non-CVD mortality and the relative risk used for smokers quoted by the US Surgeon General's report of 1989 based on the 4-year follow-up of the US Cancer Society's 50-state study (CPS-II) [17].
| Cause of death | Relative risk for smokers | |
| Males | Females | |
| COPD | 9.65 | 10.47 |
| Other Respiratory | 1.99 | 2.18 |
| Carcinoma Oesophagus | 7.6 | 10.25 |
| Carcinoma Pancreas | 2.14 | 2.33 |
| Carcinoma Larynx | 10.48 | 17.78 |
| Carcinoma Lung | 22.36 | 11.94 |
| Carcinoma Cervix | - | 2.14 |
| Carcinoma Kidney | 2.95 | 1.41 |
| Carcinoma Bladder/other urinary | 2.86 | 2.58 |
| Carcinoma Lip, Oral cavity, Pharynx | 27.48 | 5.59 |
These relative risks were used to adjust the death rates from smoking related causes of death using the formula below:
RS = Y.M/(S.(Y-1) + 1) (for smokers)
RN = M/(S.(Y-1) + 1) (for non-smokers)
Where:
Y = Relative risk for smokers.
S = Proportion of smokers.
RN = Absolute risk for non-smokers.
RS = Absolute risk for smokers.
M = Mortality rate per person.
The proportion of smokers at each age for each sex was taken from the Health Survey for England 1998 [18]. A similar formula was used by Pharoah in his life table modelling intervention with statins [10].
The model used the Framingham risks for CHD and stroke rather than the Framingham risk for CVD death as this accounted for the majority of CVD deaths and was easier to map to the UK mortality statistics. The annual risks for the various CVD risks included in the model were calculated by taking one quarter of the 4-year Framingham risk [1]. The 4-year Framingham risk was used as this is the shortest period calculable using the Framingham equation.
For the states 'Survived a myocardial infarction (MI)', 'Survived other CHD', 'Survived a stroke' and 'Survived other CVD' the risk of death is estimated by taking the Framingham risk for that individual and multiplying it with the corresponding relative risk in Table 2.
Table 2.
The relative risks of death for those with existing CVD used by the model.
| Disease state | Relative risk | Derivation |
| Previous MI. | 6.0 | Pharoah et al [10] |
| Existing CHD excluding MI. | 2.4 | |
| Previous stroke. | 1.56 | Estimated using the reciprocal of the life expectancy ratios calculated for stroke survivors in 1994 by Hannertz et al [25] |
| Other existing CVD. | 2.0 | 2.0 used as no suitable reference was identified and this figure is approximately half way between 1.56 (stroke) and 2.4 (CHD). |
Model structure
Six states are modelled: 'Alive and well', 'Survived an MI', 'survived other CHD ', 'survived a stroke', 'survived other CVD' and 'Dead'. The state 'survived other CHD' would largely consist of those who develop angina without first suffering an MI. The state 'survived other CVD' would consist of other CVD states such as intermittent claudication. Their relationships are shown in the state transition diagram in Figure 1. There is no transfer between the four states representing survival of a cardiovascular event and there is a modelling assumption that the risk of death is not increased by further cardiovascular events.
Figure 1.
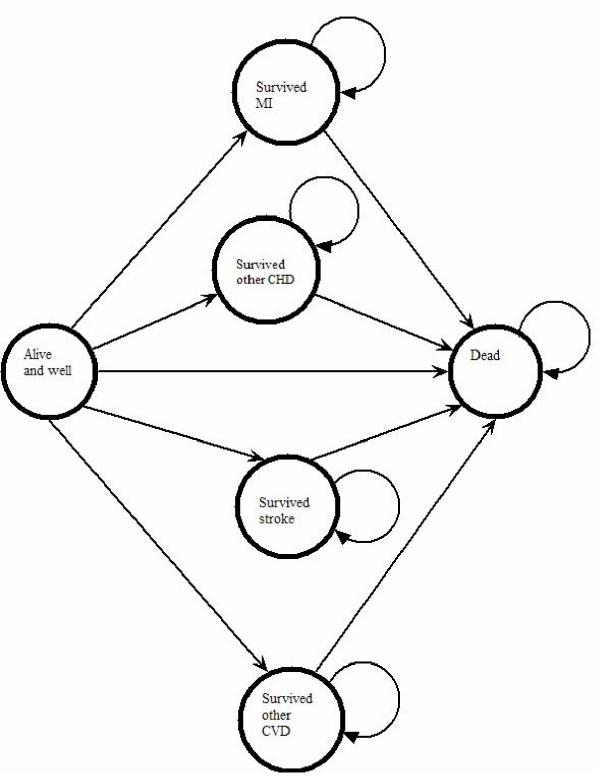
State transition diagram for the six states in the model.
The basic method used by the model is outlined in the Markov cycle-tree in Figure 2[13]. The activity diagram is shown in Figure 3. The time horizon of the model is to the age of 85, and the cycle length is one year. Through the lifetime of the individual, the model adjusts the BP and TC using the change in mean BP for each year derived from the 'Health Survey for England: cardiovascular disease in 1998' [18]. It was implemented using the Microsoft Excel™ spreadsheet package.
Figure 2.
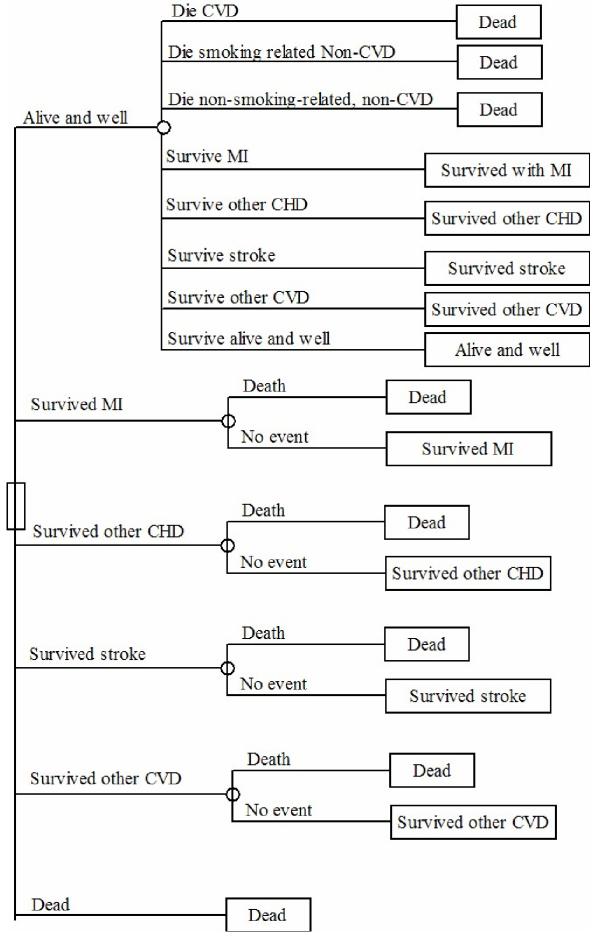
Markov cycle tree outlining the structure of the model.
Figure 3.
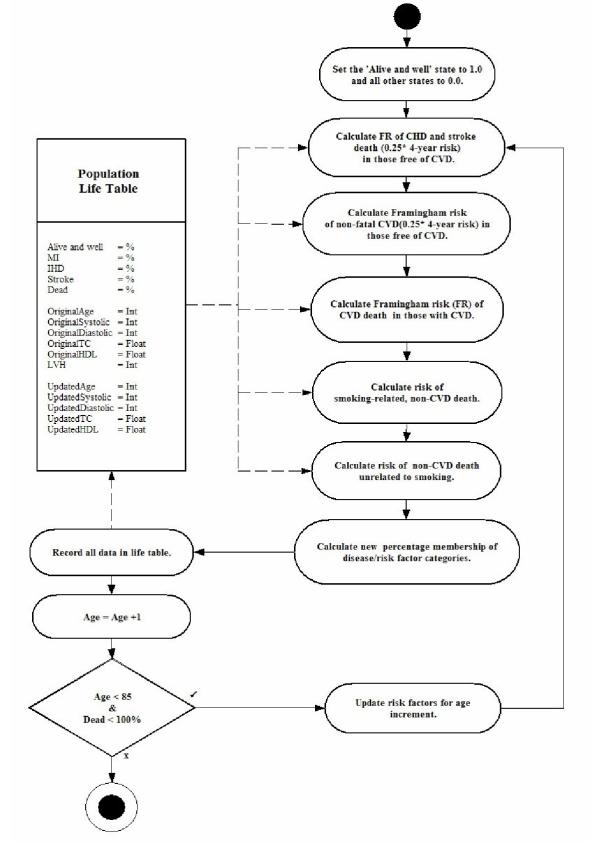
An activity diagram outlining the structure of the model.
The model estimates survival for an individual between 35 and 75. It starts at the current age of the individual, estimating mortality in each successive year, up to the time horizon of the age of 85 years taking account of the risk factors in Table 3.
Table 3.
The risk factors used in the Framingham risk equations.
| Age |
| Gender |
| Smoking status |
| Systolic or diastolic BP |
| Serum total cholesterol/high density lipoprotein ratio |
| Presence of diabetes |
| Presence of left ventricular hypertrophy |
Validation
All cases within the Whickham data set were identified between the ages of 35 and 65 and the risk factors described in Table 3 were extracted. Absence of left ventricular hypertrophy (LVH) and an average high density lipoprotein (HDL) of 1.3 for males and 1.6 for females was assumed as these are the approximate averages in the Health Survey for England: CVD in 1998 [18].
Cases with missing data or any kind of heart disease or cerebrovascular disease at baseline were excluded. The model estimate of the probability of survival for each case was identified at 20 years. Once the survival probabilities had been generated the average actual survival was calculated by finding the proportion of the cohort still alive at 20 years. The average probability of survival was calculated by finding the mean of all the estimated 20-year survival probabilities generated by the model.
Further analysis was conducted by sorting and grouping subjects in the order of their rank for each factor in Table 4. The mean actual survival in each group of these subjects was plotted against the mean estimated survival probability at 20 years.
Table 4.
Groupings used for determining correlations between the model predictions and actual mortality rates in the Whickham study.
| Ranking factor | Grouping |
| Model estimates of 20-year survival | 39 groups of 35 subjects and 1 of 29 |
| Age (1) | One year age bands |
| Age (2) | Five year age bands |
| Systolic BP | 10 mm Hg bands from 100 to 200 mm Hg |
| TC | 0.5 mmol/l bands from 3.0 to 9.99 mmol/l. |
The biological and measurement variability of BP and TC are significant. A sensitivity analysis for these two factors was conducted. For systolic BP, a total coefficient of variation (CVT) of 5.6% was taken [19] giving 95% confidence intervals (95% CI) of approximately +/- 11%. For TC, a CVT of 7.4% was used giving approximate 95% CI of +/- 15%. A grid of 12 hypothetical subjects of the ages 35, 50 and 65 with gender and smoking status was drawn up using a systolic BP of 135 mmHg for the TC sensitivity analysis and a TC of 5.5 mmol/l for the systolic BP sensitivity analysis.
A sub-group analysis was performed to examine the performance of the model in the sub-groups in Table 5.
Table 5.
Summarising the comparison of the model survival estimates with actual survival in the Whickham cohort.
| n | Model | Whickham | Difference | Diff 95%CI | Significant difference? P = | ||
| Total | 1391 | 75.0% | 75.4% | 0.4% | -1.6%, 2.4% | 0.764 | |
| Sex | Men | 676 | 70.0% | 71.3% | 1.3% | -1.7%, 4.2% | 0.402 |
| Women | 715 | 79.8% | 79.3% | -0.5% | -3.2%, 2.3% | 0.747 | |
| Age | 35–50 | 783 | 63.1% | 63.1% | 0.0% | -3.2%, 3.1% | 0.976 |
| >50 | 608 | 58.4% | 58.2% | -0.2% | -3.9%, 3.5% | 0.914 | |
| Smoking status | Smokers | 709 | 68.4% | 69.4% | 1.0% | -2.0%, 4.1% | 0.525 |
| Non-smokers | 683 | 81.9% | 81.7% | -0.3% | -2.9%, 2.3% | 0.849 | |
| Total cholesterol | TC >= 7.5 | 170 | 68.3% | 65.3% | -3.0% | -9.6%, 3.6% | 0.447 |
| TC 5.5–7.4 | 827 | 75.2% | 76.4% | 1.2% | -1.4%, 3.7% | 0.447 | |
| TC < 5.5 | 284 | 77.6% | 75.1% | -2.5% | -9.0%, 4.0% | 0.338 | |
| Systolic BP | BP >= 180 | 95 | 55.6% | 40.4% | -15.2% | -24.4%, -5.9% | 0.006 |
| BP 160–179 | 180 | 63.3% | 66.1% | 2.8% | -3.3%, 9.0% | 0.458 | |
| BP 115–159 | 1000 | 77.7% | 78.7% | 1.0% | -1.3%, 3.3% | 0.467 | |
| BP < 115 | 115 | 86.1% | 89.7% | 3.5% | -1.9%, 9.0% | 0.259 | |
| Diabetes | Diabetic | 9 | 71.4% | 55.6% | -15.8% | -43.6%, 12.0% | 0.413 |
| Non-diabetic | 1382 | 75.0% | 75.5% | 0.4% | -1.6%, 2.5% | 0.729 |
The model was used to estimate the potential gains in life expectancy (PGLE) from the elimination of CVD as a cause of death. Half cycle correction was used [13]. This was firstly done on an typical example 35 year-old non-smoking man and 35 year-old woman non-smoking with a systolic BP of 131 mmHg and a TC/HDL ratio of 4.08. Secondly, the model was used to estimate the PGLE of each 35-year-old in the Whickham sample to give the average PGLE's for these men and women at the age of 35 years.
Results and discussion
Of the 2779 people in the Whickham cohort, 1,541 were between the ages of 35 and 65 inclusive. Of these 8 had missing data. Another 142 were excluded because of pre-existing CVD. The results of the subgroup analysis are shown in Table 5. The correlation between the model's estimated survival and actual survival are shown in Table 6. Graphs showing the plots of the model's estimates of survival probability and the average survival in the Whickham cohort for each of the groups analysed in Table 3 are shown in the Figures 4, 5, 6, 7, 8 and 9.
Table 6.
A comparison of the model's predictions and actual survival.
| Ranking factor | Correlation |
| Model estimates of 20-year survival (40 groups) | 0.933 |
| Age (1-year bands) | 0.955 |
| Age (5-year bands) | 0.992 |
| Systolic BP (bands of 10 mmHg) | 0.936 |
| TC (bands of 0.5 mmol/l) | 0.693 |
Figure 4.
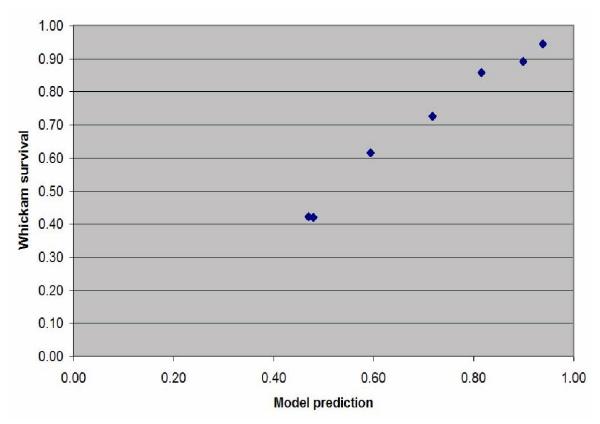
Scatterplot of the estimated probability of survival against the actual survival in the subjects grouped into seven 5-year age bands between 35 and 65 years old.
Figure 5.
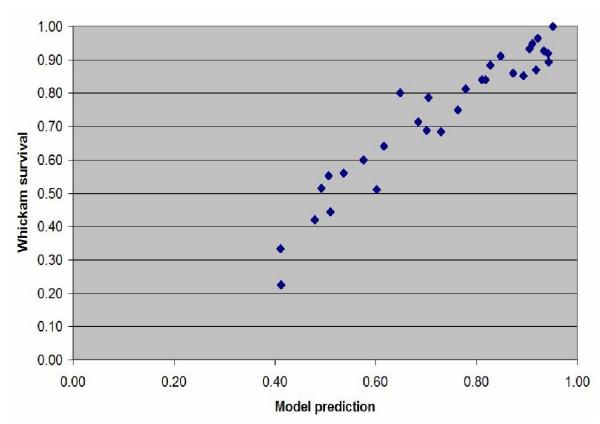
Scatterplot of the estimated probability of survival against the actual survival in the subjects grouped into fifty one 1-year age bands between 35 and 65 years old.
Figure 6.
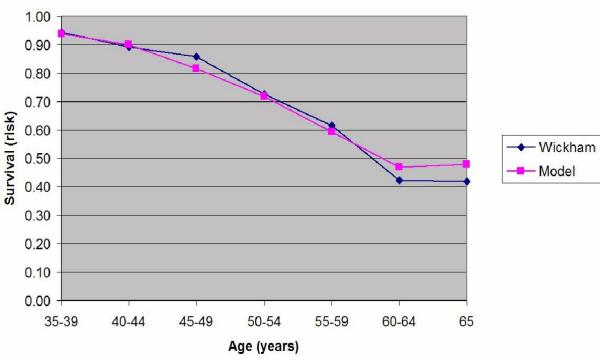
Plot of the estimated probability of survival and the actual survival in the subjects grouped into seven 5-year age bands between 35 and 65 years old.
Figure 7.
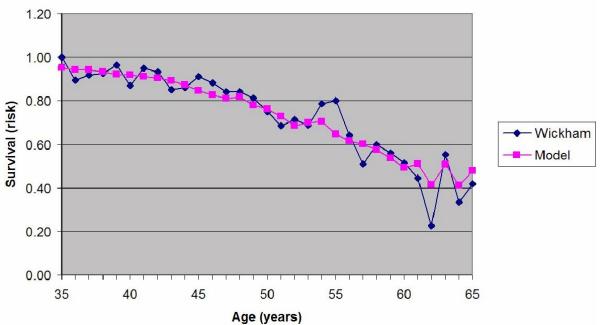
Plot of the estimated probability of survival and the actual survival in the subjects grouped into fifty one 1-year age bands between 35 and 65 years old.
Figure 8.
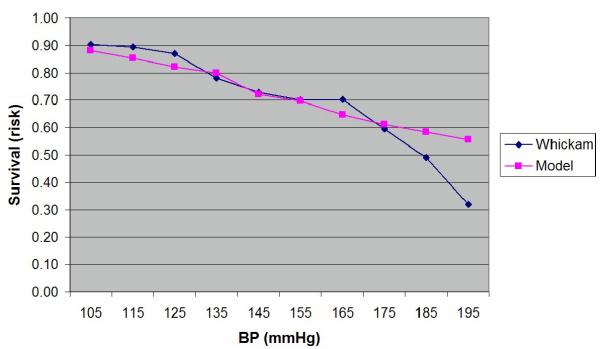
Plot of the estimated probability of survival and the actual survival in the subjects grouped into ten 10 mmHg bands for systolic BP between 100 and 200 mmHg.
Figure 9.
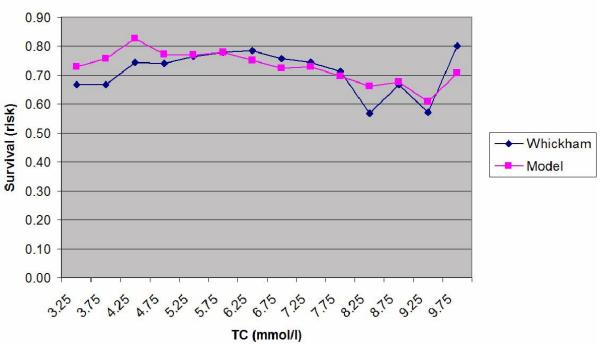
Plot of the estimated probability of survival and the actual survival in the subjects grouped into fourteen 0.5 mmol/l bands for total cholesterol (TC) between 3.0 and 10.0 mmol/l.
There is a high level of agreement between the predictions of the model and the actual survival in the Whickham cohort. However, as can be seen from the Table 5, the model statistically significantly underestimates mortality at twenty years in those people with a systolic BP over 180 mmHg even though there were only 95 cases in that group (p = 0.006). There were no other significant differences between the two groups.
The correlations between model estimates of the probability of survival and actual survival in the specified groupings are given in Table 6. The results of the sensitivity analysis are given in Table 7.
Table 7.
Sensitivity analysis for uncertainties in systolic BP and TC and their measurement. The three hypothetical BPs given are adjusted by +/- 11% and the TCs by +/- 15%. A 'normal' BP of 135 mmHg systolic is assumed for the TC analysis and a 'normal' cholesterol of 5.5 mmol/l is taken for the BP analysis. Values for the predicted survival at 20 years are given.
| Systolic BP mmHg (95% CI) | TC mmol/l (95% CI) | ||||||
| 120 (107 – 133) | 140 (125 – 155) | 160 (142 – 178) | 4.0 (3.4 – 4.6) | 6.0 (5.1 – 6.9) | 8.0 (6.8 – 9.2) | ||
| 35 year old man | S | 94.2 – 92.9 | 93.4 – 90.9 | 92.2 – 88.0 | 94.0 – 93.3 | 93.0 – 91.5 | 91.6 – 89.0 |
| NS | 96.0 – 95.5 | 95.7 – 94.6 | 95.2 – 93.3 | 95.8 – 95.6 | 95.5 – 94.9 | 95.0 – 93.9 | |
| 35 year-old woman | S | 95.3 – 95.3 | 95.3 – 95.2 | 95.3 – 95.1 | 95.4 – 95.3 | 95.3 – 95.2 | 95.2 – 94.9 |
| NS | 96.9 – 96.9 | 96.9 – 96.8 | 96.9 – 96.8 | 96.9 – 96.9 | 96.9 – 96.9 | 96.9 – 96.8 | |
| 50 year old man | S | 73.0 – 68.3 | 69.9 – 63.0 | 66.2 – 56.7 | 72.8 – 70.1 | 68.9 – 64.0 | 64.3 – 57.8 |
| NS | 84.9 – 82.4 | 83.3 – 79.2 | 81.2 – 74.8 | 84.7 – 83.4 | 82.8 – 79.9 | 80.1 – 75.5 | |
| 50 year-old woman | S | 79.6 – 79.3 | 79.4 – 78.7 | 79.1 – 77.7 | 79.9 – 79.6 | 79.4 – 78.5 | 78.5 – 76.7 |
| NS | 89.1 – 89.0 | 89.0 – 88.8 | 88.9 – 88.5 | 89.2 – 89.1 | 89.0 – 88.7 | 88.7 – 88.0 | |
| 65 year old man | S | 16.8 – 14.7 | 15.4 – 12.7 | 13.9 – 10.6 | 16.8 – 15.5 | 14.9 – 13.1 | 13.2 – 11.2 |
| NS | 50.3 – 46.4 | 47.8 – 42.3 | 44.8 – 37.5 | 50.3 – 48.8 | 47.0 – 43.0 | 43.2 – 38.2 | |
| 65 year-old woman | S | 37.1 – 36.7 | 36.9 – 36.0 | 36.5 – 35.1 | 37.7 – 37.2 | 36.9 – 35.6 | 35.7 – 33.7 |
| NS | 63.6 – 63.3 | 63.5 – 62.8 | 63.2 – 62.0 | 64.0 – 63.7 | 63.5 – 62.5 | 62.6 – 60.7 | |
S = Smoker NS = Non-smoker
The PGLE for our typical 35 year-old man was 2.7 years and 1.8 years for our typical 35-year-old woman. For the twenty-four 35-year-old men in the sample used in the validation, the average PGLE was 4.0 years. For the thirty-two 35-year-old women the PGLE was 1.8 years.
Discussion
The survival estimated by this model, and the observed survival in the Whickham study correlate highly. It significantly overestimates survival in those with a systolic BP of 180 mmHg or more (p = 0.006).
For 50-year-old men the sensitivity analysis shows up to a 9.5% range in the 95% confidence intervals (CI) for the estimated survival at 20 years based on 3 BP readings and a 6.5% range based on a single measurement of the TC. Otherwise the 95% CI do not exceed +/- 2% of the mean. This would underline the need to take more than 3 BP readings and at least two serum TC measurement in middle aged men.
This model is focused on individuals and is not a population simulation as is the CHD Policy Model [6]. Consequently it can be used to give individualised risk information in real time. Grover et al used data from the Lipid Research Clinics cohort and included a multivariate model for death from 'other causes' in addition to CHD and stroke and so took account of competing causes of death [12]. In addition to modelling competing risk of death, the model described here adjusts the risks of non-cardiovascular death by smoking status and also models the change in BP and cholesterol through a lifetime.
This system may be of value in the development of public health programs where different intervention and prevention strategies could be modelled giving reliable estimates of the impact on survival. The inclusion of an adjustment for the non-CVD risks of death from smoking is particularly important here, as these competing causes of death will have a greater impact in smokers than in non-smokers.
Tools such as these will naturally be attractive to insurers for actuarial assessment but their use may be controversial. The model may reduce uncertainty in survival in certain groups and reduce risk in setting the levels of premiums. However, this could be regarded as undermining the very principles on which insurance is based – uncertainty and the sharing of risk.
The weaknesses of the model and further development
Historical variation and the effect on conclusions of validity
The Framingham equations used here were developed from cohort data collected in the 1960s and 1970s. We know that since then there has been a fall in the incidence of CHD mortality and a change in the prevalence of smoking. Whilst it may be that the change in incidence is due to the change in the prevalence of risk factors included in the Framingham equation, we cannot be sure that there are not other extraneous factors that have varied over that time and may have affected the incidence of CHD. If so, the validity of the Framingham equation in modern populations may be undermined. For example, some other risk factor such as serum fibrinogen levels, homocysteine, soft water, chlamydia infection or an as yet undetected factor my have altered which would distort the Framingham predictions. It is not just risk factors that are relevant here, but also protective factors such as a moderate intake of red wine [20] or exercise [21]. We have used the Whickham survey that collected its 20-year follow-up data in the early 1990s. This model will be used in individuals at the beginning of a period of prediction rather than at the end, so the best we can say is that this model was valid when making predictions of survival in a UK population 30 years ago when the Whickham data was first being collected.
Smoking cessation
This model makes a number of assumptions about non-smokers and smokers that do not quite fit the real world. These assumptions are that:
• Smokers remain smokers and do not quit.
• Non-smokers have never smoked at all.
If this model were to be used to assess the benefits of quitting smoking, it would be on the assumption that a quitter's risk falls instantly to the risk of non-smokers. These are clearly invalid assumptions. When evaluating the survival of smokers it is on the assumption that they will remain smokers all their life. This impacts upon our evaluation, because those individuals who were recorded as smokers at their baseline assessment at time 0 were assumed to remain smokers until death or their 20-year follow-up. Clearly many will have given up in the intervening period. The net results of this would be an overestimate of mortality in smokers. This is in keeping with our results that show a small, non-significant overestimate of mortality in smokers.
The risks of ex-smokers probably never fall to those of non-smokers, and the reduction in risk varies with the age at which you quit. Quitting before middle-age reaps greater benefit than quitting later in life [22]. It would be feasible to use the different relative risk for ex-smokers given in the Surgeon General's report of 1989 to improve the model for ex-smokers. It would even be possible to indicate the impact of quitting at various times in the future.
Modelling intervention
This model can give an indication of life gained with intervention or elimination of CHD and stroke. For example, our typical 35 year-old, non-smoking man (systolic BP of 131 and a TC/HDL ratio of 4.08) eliminating CHD and stroke as a cause of death (relative risk reduction of 100%) would reduce his mortality to the age of 85 of by about 12.1% (Figure 10). This amounts to an average PGLE of 2.71 years. The pale yellow coloured part of the graph in Figure 10 represents the life gained.
Figure 10.
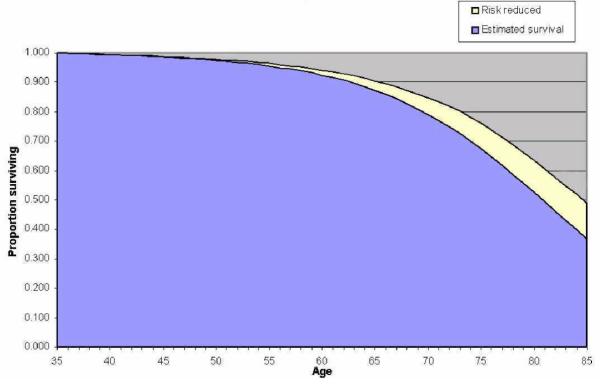
The improvement in survival gained from eliminating CVD in a typical non-smoking 35 year-old man.
The Coronary Heart Disease Policy Model predicted the PGLE from eliminating CHD to be 3.1 years for men. This is in keeping with the predictions of our model. However, the Coronary Heart Disease Policy Model also predicted a PGLE of 3.3 years for women. This is actually higher than the quoted PGLE for men and nearly double the PGLE predicted by our model. CVD death rates are higher in men than women across all ages in the UK and so the model described here would seem more consistent with the observed epidemiological data [16].
If the forty people aged 55 in this study reduced their risk of CHD or stroke by 88%, then the PGLE would be 2.2 years. Wald et al in their paper on the Polypill estimated that a third of 55 year-olds would gain about 11 years free of CHD events [23]. Their 'simple Markov model' did take account of CVD as well as of 'dying from another cause' but had markedly divergent results from this study. This may reflect the small sample size of 55 year-olds in this study (n = 40), or a failure of Wald's model to take into account all of the factors included in this model.
Mackenbach estimated that the PGLE from the elimination of CVD would be about 4.0 years from birth [24]. This would seem to be in keeping with the results of our model as the proportion of deaths from CVD prior to the age of 35 is very small [16]. On the whole it would seem that the predictions of this model are in keeping with the bulk of other model estimates of PGLE.
Conclusions
This model gives valid estimates of 20-year survival in Whickham cohort members between the ages of 35 and 60 who are free of CVD and have systolic BPs below 180 mmHg. It could form the basis of a decision aid in the primary prevention of CVD. It would be useful in the modelling of intervention and prevention strategies and could be a valuable tool for actuarial assessment.
Competing interests
Dr Chris Martin: Thurrock Primary Care NHS Trust has purchased a license to use an implementation of this model in primary care consultations. Dr Martin may further exploit any intellectual property rights arising from this work.
Dr Mark Vanderpump: none declared.
Mrs Joyce French: None declared.
Authors' contributions
CM conceived and created the model. He performed the validation and was the principal author of the paper. MVP and JF collected, cleaned and analyzed the Wickham cohort data that was used for the model validation and commented on the final draft of the paper.
Pre-publication history
The pre-publication history for this paper can be accessed here:
Acknowledgments
Acknowledgements
This study was conducted as the dissertation for the MSc in Health Informatics at the Centre for Health Informatics and Medical Education at the University College London. Particular thanks go to Dr Paul Taylor Director of the M.Sc. course and my PhD supervisor. Professor Patrick Vallance Director of the Centre for Clinical Pharmacology, Therapeutics and Toxicology at UCL who supervised the M.Sc. dissertation. The Eastern Regional Health Authority of the NHS supported my M.Sc. and this study with an Enterprise Award Scheme grant directed by Dr Jim Elliot. The principal author is the lead researcher in the Laindon Health Centre Primary Care Research Team, which is supported by a grant from the Essex Primary Care Research Network (EPCRN) formerly part of the East London and Essex Network of Researchers (ELENoR). Thanks are due to Dr Elizabeth Murray, my secondary supervisor, and Drs Montgomery and Grover and Martin for constructive criticism of the paper.
Contributor Information
Chris Martin, Email: chris.martin@laindonhc.org.uk.
Mark Vanderpump, Email: mark.vanderpump@royalfree.nhs.uk.
Joyce French, Email: hamsterley@hotmail.com.
References
- Anderson KM, Wilson PW, Odell PM, Kannel WB. An updated coronary risk profile. A statement for health professionals. Circulation. 1991;83:356–362. doi: 10.1161/01.cir.83.1.356. [DOI] [PubMed] [Google Scholar]
- Wood D, Durrington P, Poulter N, McInnes G, Rees A, Wray R. Joint British recommendations on prevention of coronary heart disease in clinical practice. British Cardiac Society, British Hyperlipidaemia Association, British Hypertension Society, endorsed by the British Diabetic Association. Heart. 1998;80:S1–29. [PMC free article] [PubMed] [Google Scholar]
- Department of Health National Service Framework for Coronary Heart Disease: Main document. Department of Health. 2000.
- Baker S, Priest P, Jackson R. Using thresholds based on risk of cardiovascular disease to target treatment for hypertension: modelling events averted and number treated. BMJ. 2000;320:680–685. doi: 10.1136/bmj.320.7236.680. [DOI] [PMC free article] [PubMed] [Google Scholar]
- Montgomery AA, Fahey T, Ben Shlomo Y, Harding J. The influence of absolute cardiovascular risk, patient utilities, and costs on the decision to treat hypertension: a Markov decision analysis. J Hypertens. 2003;21:1753–1759. doi: 10.1097/00004872-200309000-00026. [DOI] [PubMed] [Google Scholar]
- Tsevat J, Weinstein MC, Williams LW, Tosteson AN, Goldman L. Expected gains in life expectancy from various coronary heart disease risk factor modifications. Circulation. 1991;83:1194–1201. doi: 10.1161/01.cir.83.4.1194. [DOI] [PubMed] [Google Scholar]
- Lai D, Hardy RJ. Potential gains in life expectancy or years of potential life lost: impact of competing risks of death. Int J Epidemiol. 1999;28:894–898. doi: 10.1093/ije/28.5.894. [DOI] [PubMed] [Google Scholar]
- Lloyd-Jones DM, Larson MG, Beiser A, Levy D. Lifetime risk of developing coronary heart disease. Lancet. 1999;353:89–92. doi: 10.1016/S0140-6736(98)10279-9. [DOI] [PubMed] [Google Scholar]
- Magni P, Quaglini S, Marchetti M, Barosi G. Deciding when to intervene: a Markov decision process approach. Int J Med Inf. 2000;60:237–253. doi: 10.1016/S1386-5056(00)00099-X. [DOI] [PubMed] [Google Scholar]
- Pharoah PD, Hollingworth W. Cost effectiveness of lowering cholesterol concentration with statins in patients with and without pre-existing coronary heart disease: life table method applied to health authority population. BMJ. 1996;312:1443–1448. doi: 10.1136/bmj.312.7044.1443. [DOI] [PMC free article] [PubMed] [Google Scholar]
- Weinstein MC, Coxson PG, Williams LW, Pass TM, Stason WB, Goldman L. Forecasting coronary heart disease incidence, mortality, and cost: the Coronary Heart Disease Policy Model. Am J Public Health. 1987;77:1417–1426. doi: 10.2105/ajph.77.11.1417. [DOI] [PMC free article] [PubMed] [Google Scholar]
- Grover SA, Paquet S, Levinton C, Coupal L, Zowall H. Estimating the benefits of modifying risk factors of cardiovascular disease: a comparison of primary vs secondary prevention. Arch Intern Med. 1998;158:655–662. doi: 10.1001/archinte.158.6.655. [DOI] [PubMed] [Google Scholar]
- Sonnenberg FA, Beck JR. Markov models in medical decision making: a practical guide. Med Decis Making. 1993;13:322–338. doi: 10.1177/0272989X9301300409. [DOI] [PubMed] [Google Scholar]
- Vanderpump MP, Tunbridge WM, French JM, Appleton D, Bates D, Clark F, Grimley EJ, Rodgers H, Tunbridge F, Young ET. The development of ischemic heart disease in relation to autoimmune thyroid disease in a 20-year follow-up study of an English community. Thyroid. 1996;6:155–160. doi: 10.1089/thy.1996.6.155. [DOI] [PubMed] [Google Scholar]
- Tunbridge WM, Evered DC, Hall R, Appleton D, Brewis M, Clark F, Evans JG, Young E, Bird T, Smith PA. Lipid profiles and cardiovascular disease in the Whickham area with particular reference to thyroid failure. Clin Endocrinol (Oxf) 1977;7:495–508. doi: 10.1111/j.1365-2265.1977.tb01341.x. [DOI] [PubMed] [Google Scholar]
- Office for National Statistics Mortality Statistics: General: Series DH1 no. 31. The Stationery Office. 1998.
- Surgeon General 1989 Surgeon General Report: Reducing the Health Consequences of Smoking. US Dept Health and Human Services. 1989.
- Erens B, Primatesta P. Health Survey for England: Cardiovascular Disease. National Statistical Office. 1999.
- Moore CR, Krakoff LR, Phillips RA. Confirmation or exclusion of stage I hypertension by ambulatory blood pressure monitoring. Hypertension. 1997;29:1109–1113. doi: 10.1161/01.hyp.29.5.1109. [DOI] [PubMed] [Google Scholar]
- Wollin SD, Jones PJ. Alcohol, red wine and cardiovascular disease. J Nutr. 2001;131:1401–1404. doi: 10.1093/jn/131.5.1401. [DOI] [PubMed] [Google Scholar]
- Manson JE, Greenland P, LaCroix AZ, Stefanick ML, Mouton CP, Oberman A, Perri MG, Sheps DS, Pettinger MB, Siscovick DS. Walking compared with vigorous exercise for the prevention of cardiovascular events in women. N Engl J Med. 2002;347:716–725. doi: 10.1056/NEJMoa021067. [DOI] [PubMed] [Google Scholar]
- Taylor DH, Jr, Hasselblad V, Henley SJ, Thun MJ, Sloan FA. Benefits of smoking cessation for longevity. Am J Public Health. 2002;92:990–996. doi: 10.2105/ajph.92.6.990. [DOI] [PMC free article] [PubMed] [Google Scholar]
- Wald NJ, Law MR. A strategy to reduce cardiovascular disease by more than 80% BMJ. 2003;326:1419. doi: 10.1136/bmj.326.7404.1419. [DOI] [PMC free article] [PubMed] [Google Scholar]
- Mackenbach JP, Kunst AE, Lautenbach H, Oei YB, Bijlsma F. Gains in life expectancy after elimination of major causes of death: revised estimates taking into account the effect of competing causes. J Epidemiol Community Health. 1999;53:32–37. doi: 10.1136/jech.53.1.32. [DOI] [PMC free article] [PubMed] [Google Scholar]
- Hannerz H, Nielsen ML. Life expectancies among survivors of acute cerebrovascular disease. Stroke. 2001;32:1739–1744. doi: 10.1161/01.str.32.8.1739. [DOI] [PubMed] [Google Scholar]


