Figure 5.

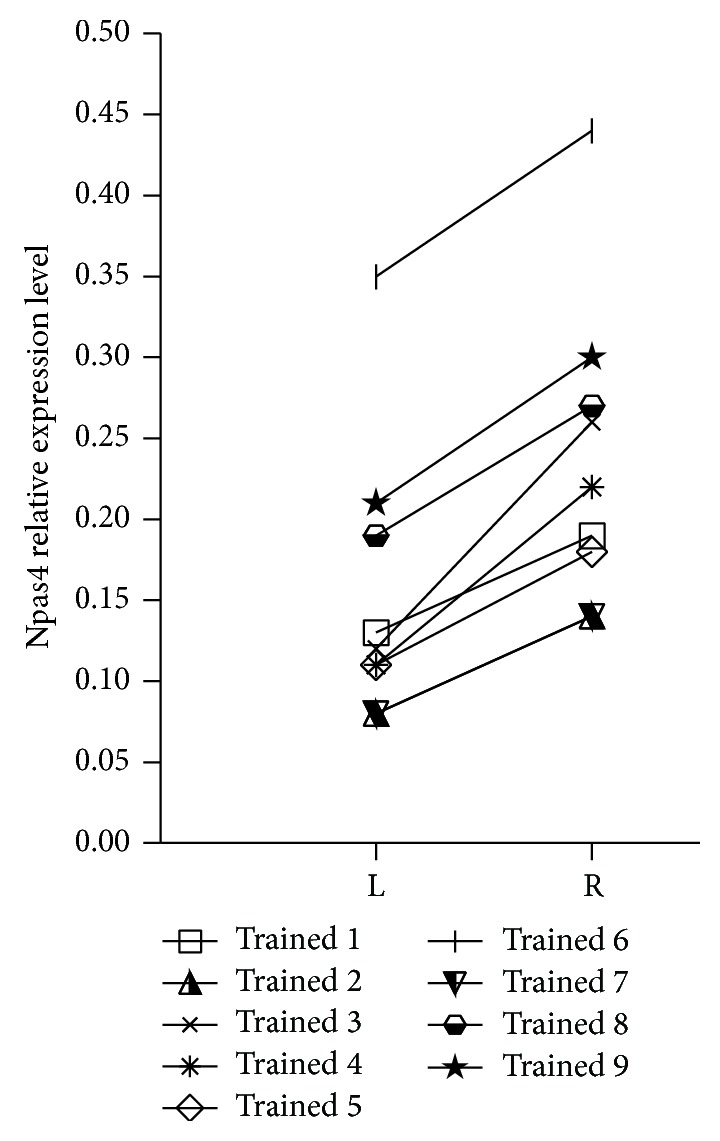
Changes of Npas4 mRNA expression in individual conditioned mice—comparison between trained row B of barrels (R: right) and control row B (L: left).

Changes of Npas4 mRNA expression in individual conditioned mice—comparison between trained row B of barrels (R: right) and control row B (L: left).