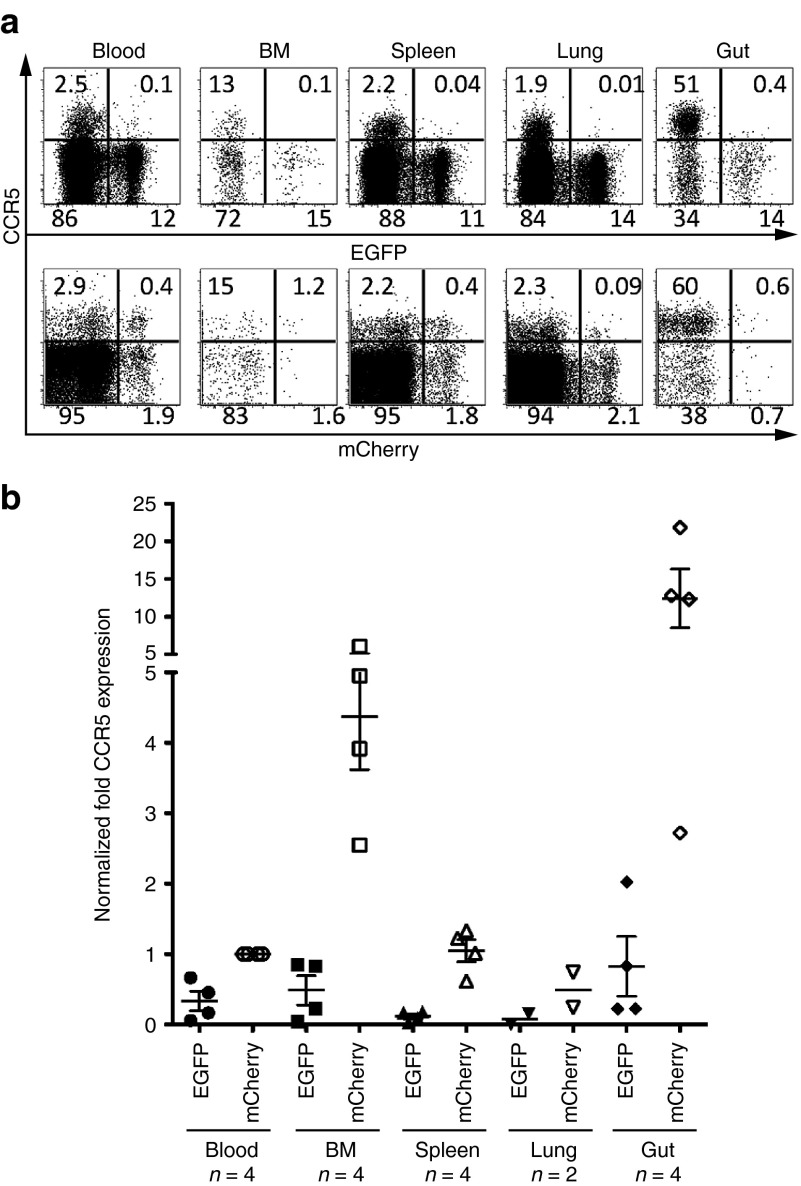
Figure 1.
CCR5 downregulation in EGFP+ CD4+ T cells in the reconstituted hu BLT mice. (a) Representative data for CCR5 expression in CD4+ T cells. Upper panel shows EGFP+ sh1005 vector marked CD4+ T cells and lower panel shows mCherry+ control vector marked CD4+ T cells. Numbers in each quadrant indicate the percentage. (b) The level of CCR5 expression was compared in EGFP+ and mCherry+ human CD4+ T cells in lymphoid tissues from multiple transplanted hu BLT mice. We normalized CCR5 expression level using the mean CCR5 expression in mCherry+ cells from peripheral blood (Blood) as 1. Samples were obtained between 21 and 26 weeks after human Thy/Liv implantation. Bar represents mean value; n indicates number of mice.

