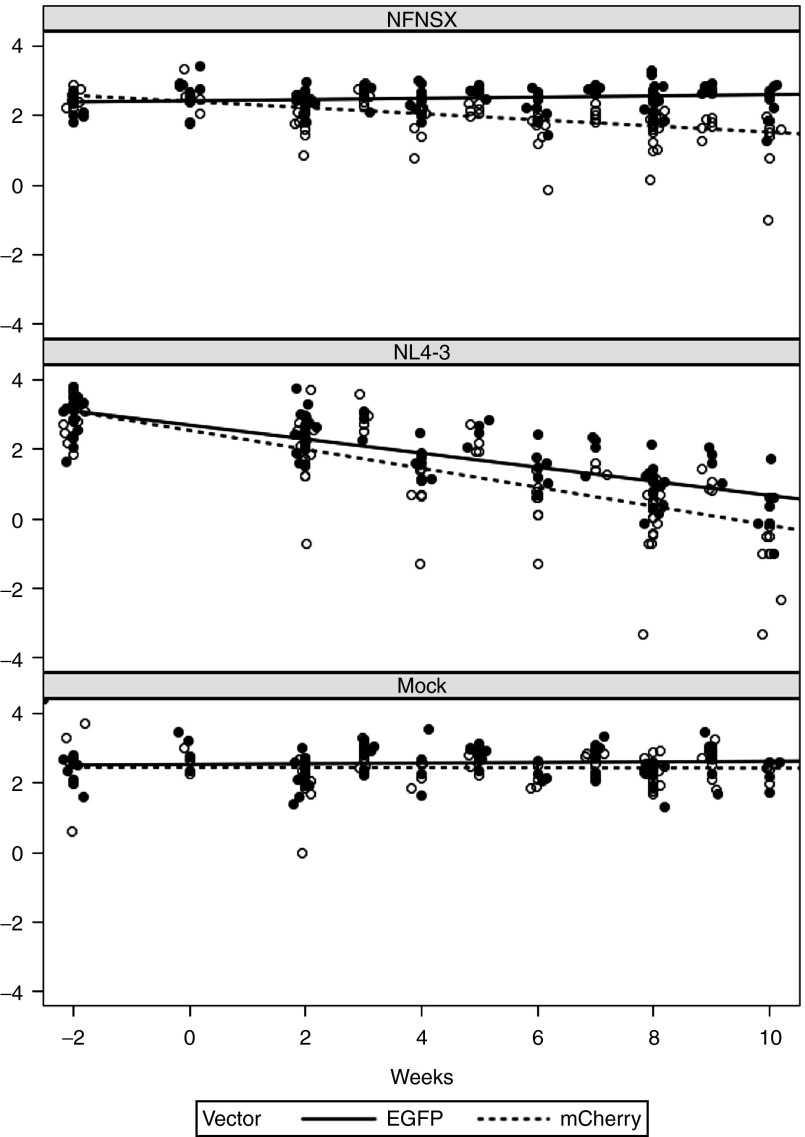
Figure 3.
Model slopes of CD4/CD8 ratio in peripheral blood. The relative changes in CD4/CD8 ratio of sh1005- (EGFP+) and no-shRNA control- (mCherry+) modified CD4+ T lymphocytes in peripheral blood were compared using a linear mixed effects model by including all data from the three cohort experiments (Ex1, EX2 and EX3). CD4/CD8 ratio in shRNA-transduced cells (EGFP+, dotted line) and control cells (mCherry, solid line) overlayed on raw values (EGFP+, open circle; mCherry+, solid circle) were shown.

