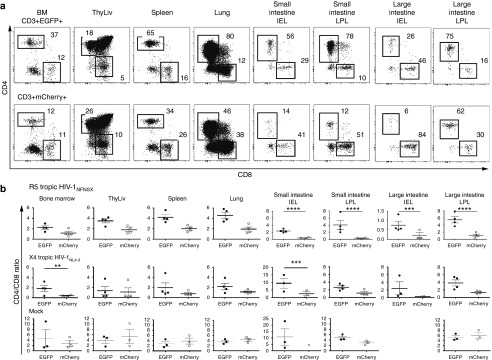
Figure 4.

Maintenance of CD4/CD8 ratio in sh1005-modified CD4+ T cells in lymphoid tissue. (a) Representative data for percentage of CD4 and CD8 expression in EGFP+ (top panels) and mCherry+ (bottom panels) CD3+ T lymphocytes in bone marrow (BM), spleen, lung, small and large intestine (SI and LI) and intraepithelial lymphocytes (IEL) and lamina propria lymphocytes (LPL) in a R5 tropic HIV-1NFNSX–challenged hu BLT mice. CD4+ and CD8+ populations were gated and percentages are shown. (b) The data of CD4/CD8 ratio in EGFP+ CD3+ T lymphocytes (solid circle) and in mCherry+ lymphocytes (open circle) from all analyzed mice are shown. Samples were obtained between 8 and 12 weeks after HIV-1 challenge. A bar represents the mean value. **P ≤ 0.01. ***P ≤ 0.001. ****P ≤ 0.0001.
