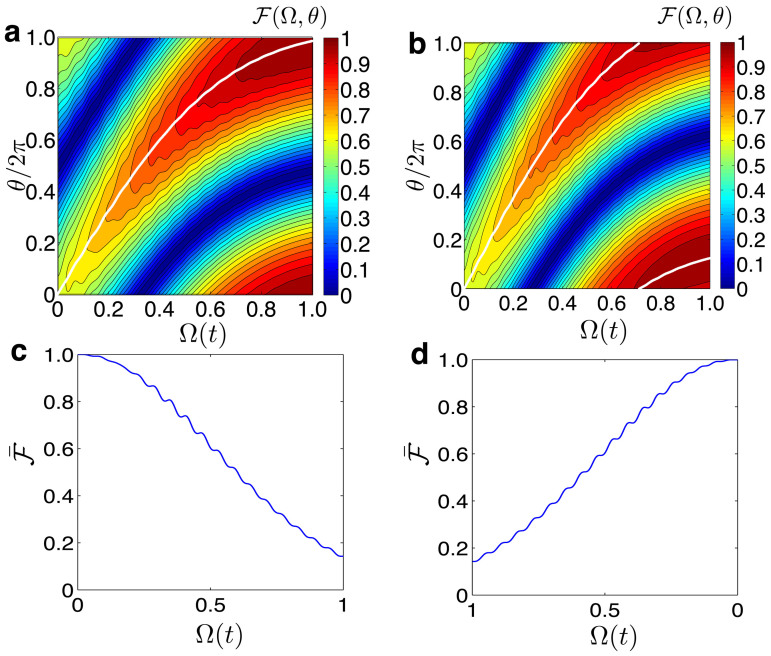
Figure 3.
(a) Contour plots of the fidelity  between the state
  and the state |ψ(t)〉, which has adiabatically evolved from the initial state |ψs〉 = αF|ψ0〉 + βF|ψ1〉, when the total evolution time is set to T = 105/ωcav, and (b) when the evolution time is T = 120/ωcav. For the above cases, the black lines stand for the phase which maximized the fidelity
  . In these simulations, the parameters are ωcav = 1, ωeg = 0.1 ωcav, and Ω0 = ωcav. (c) Storage process for an entangled state
  . (d) Retrieval process. In both cases, we plot the fidelity between the initial state |Ψ0〉, and the instantaneous state |ψ(t)〉,
  . In the simulations (c) and (d), we have chosen ωcav = 1, ωeg = 0.1 ωcav, Ω0 = ωcav, and the evolution time T = 105/ωcav.

