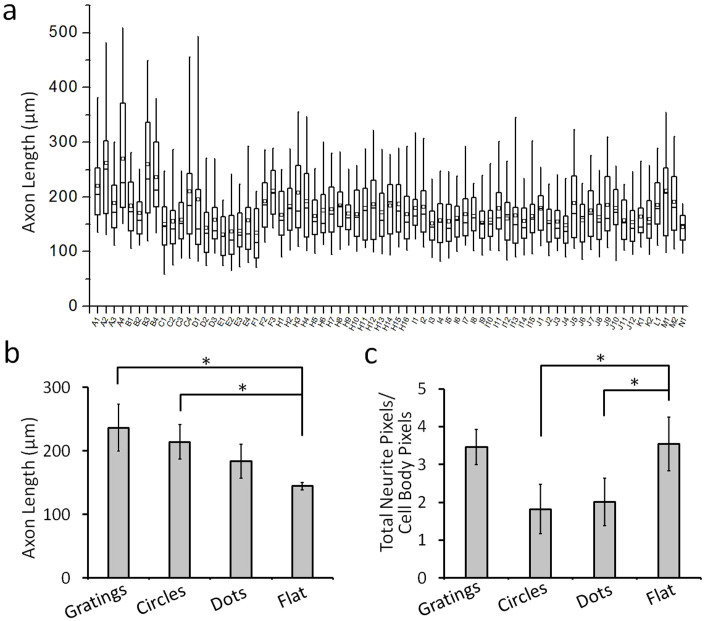
Figure 5. Quantification and analysis of axonal outgrowth.
(a) Box-plot of the axonal length for cells growing on different patterns, n > 60 cells were quantified. The parts of the box plots indicate 25 and 75 percentiles, while the whiskers range is 5 and 95%. The square box indicates mean of the data, (n > 60 cells were quantified). (b) Average axonal length of neurons growing on gratings, circles, dots, and flat surface. (c) Value of total neurite pixel/cell body pixel of neurons growing on gratings, circles, dots, and flat surface. Error bars indicated s.e.m. from three independent experiments, *P < 0.05 by one way ANOVA test.

