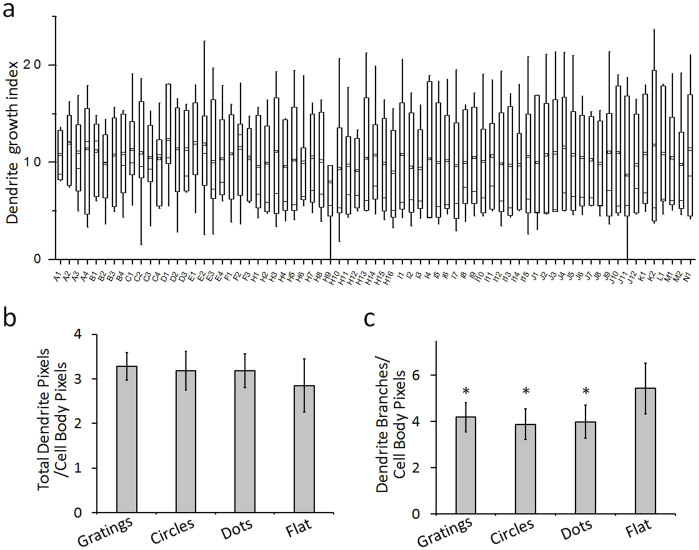
Figure 6. Quantification and analysis of dendritic outgrowth.
(a) Box-plot of dendrite growth index for cells growing on different patterns, n > 60 cells were quantified. The parts of the box plots indicate 25 and 75 percentiles, while the whiskers range is 5 and 95%. The square box indicates mean of the data, (n > 60 cells were quantified). (b) Dendritic growth index for neurons on patterns with gratings, circles, dots, and flat surface. The index was derived by taking ratio of total dendritic pixels to cell body pixels. (c) Dendrite branching index for neurons on patterns with gratings, circles, dots, and flat surface. The index was drived by taking the ratio of total branching points to cell body pixels. Error bars indicated s.e.m from three independent experiments, * P < 0.05 by one way ANOVA test.

