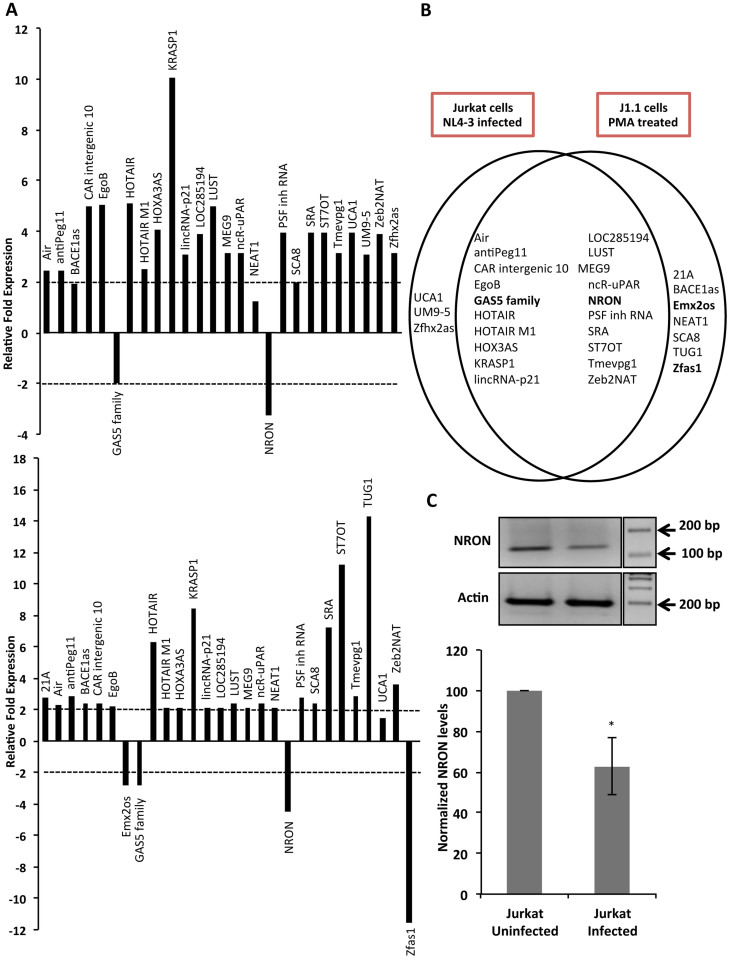
Figure 1. Differential expression of lncRNAs in HIV-1 infected cells.
(A) Profiling results from Jurkat cells infected with HIV-1 NL4-3 (top) and J1.1 cells following PMA treatment (bottom). The plots show relative fold expression compared to control cells for three replicates. The dotted lines indicate the selected 2-fold cut-off. (B) Venn diagram summarizing the profiling results in the two experimental systems. The lncRNAs marked in bold were downregulated while others were upregulated. (C) Validation of NRON downregulation in HIV-1 NL4-3 infected Jurkat cells at 48 hpi by semi-quantitative RT-PCR. A representative cropped gel image is shown for NRON and Actin RNAs where the semi-quantitative RT-PCR products were run in a 2% agarose gel in same experimental condition. The full images are shown in Fig. S7A. The plot shows densitometry of gels from three separate experiments shown as mean values ± SD; * p<0.05.

