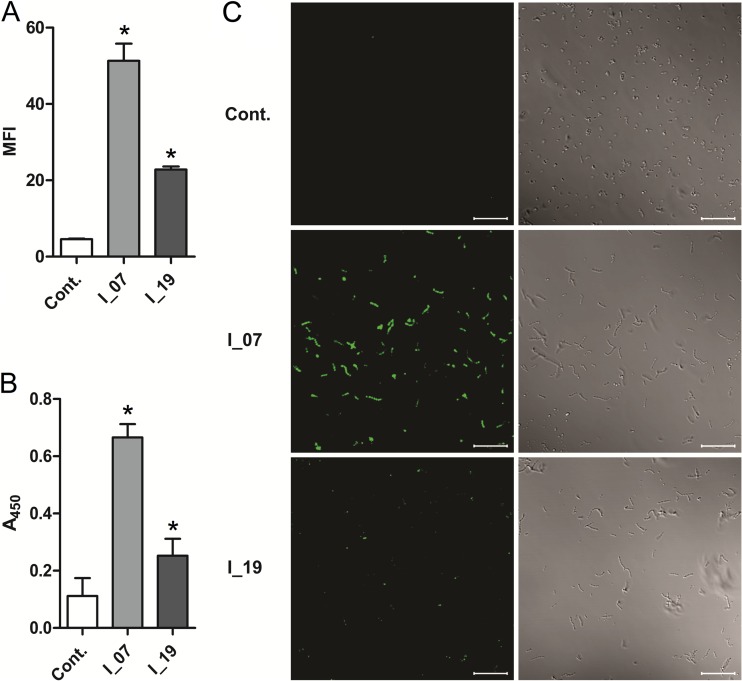
FIG 2.
Flow cytometry (A), whole-cell ELISA (B), and fluorescence microscopy (C) results for L. lactis cells expressing DARPins I_07 and I_19, detected with FITC-conjugated human IgG. Cont., control containing empty plasmid pNZ8148. MFI, mean fluorescence intensity; A450, absorbance at 450 nm. Error bars denote standard deviations. *, significant difference (t test; P < 0.05) in comparison to control. (C) (Left) Fluorescence images. (Right) Bright-field images. Bars = 20 μm.

