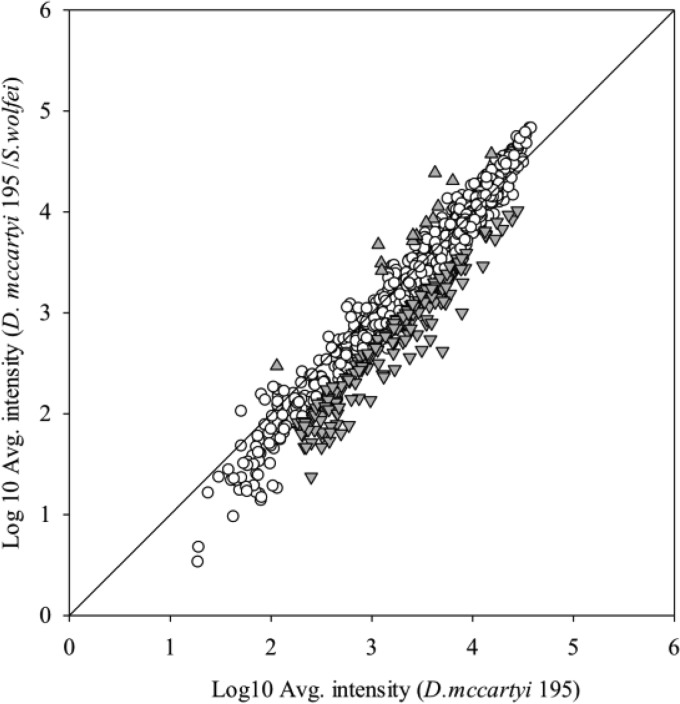
FIG 4.
Microarray signal intensities of transcripts from strain 195 grown alone versus those grown in coculture with S. wolfei (gray-shaded points represent statistically significant differential transcription, average intensity >20 [P < 0.05], >2-fold difference, genes significantly upregulated [▲] or downregulated [▼] in coculture versus strain 195 monoculture). All measurements are averages from three biological replicates.

