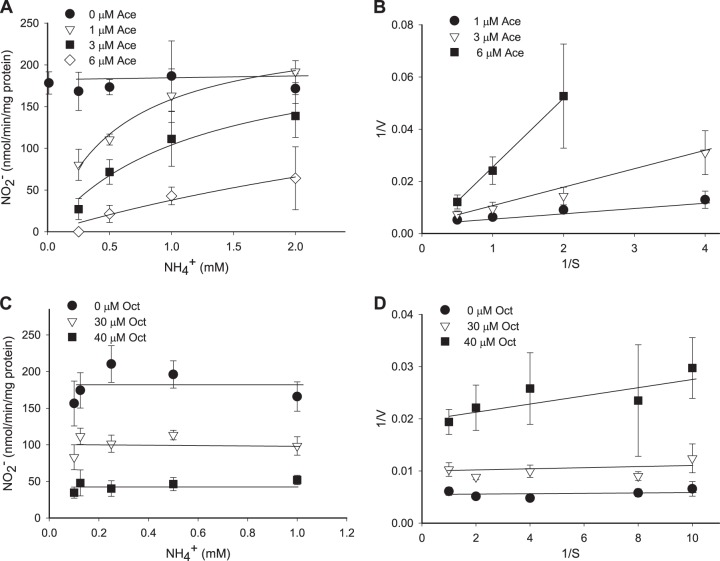
FIG 3.
Response of initial velocities of NO2− production by N. viennensis to acetylene (A and B) and octyne (C and D) at increasing concentrations of NH4+. (A) Inhibition by 1 μM acetylene is overcome by increasing the NH4+ concentration. (B) Lineweaver-Burk double-reciprocal plot shows that the slopes for each acetylene concentration differ, indicating competitive inhibition. (C) Vi decreases with higher octyne concentrations, but octyne inhibition cannot be overcome by increasing NH4+. (D) Lineweaver-Burk double-reciprocal plots intercept the 1/V0 axis at different values indicating noncompetitive inhibition. Error bars represent the standard deviations of three replicates.

