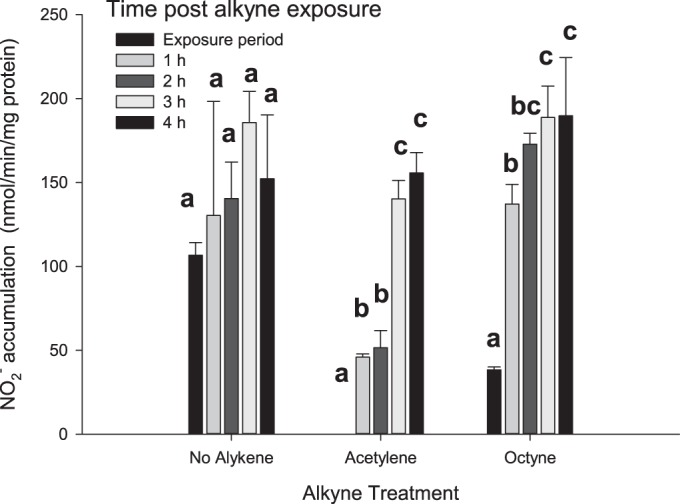
FIG 4.

Response of NO2− production by N. viennensis after acetylene or octyne exposure. Cells were exposed for 2 h to either 6 μM acetylene or 40 μM octyne in media with 0.5 mM NH4+. Alkyne and no-alkyne treatments were then degassed and NH4+ increased to 2 mM. NO2− accumulation was monitored after alkyne exposure for 4 h. Bars represent the average activity in three replicate treatments. Error bars represent the standard deviations of the average. Lowercase letters indicate the significance (P ≤ 0.02) of sampling time within a specific treatment. Values that have lowercase letters in common are not significantly different.
