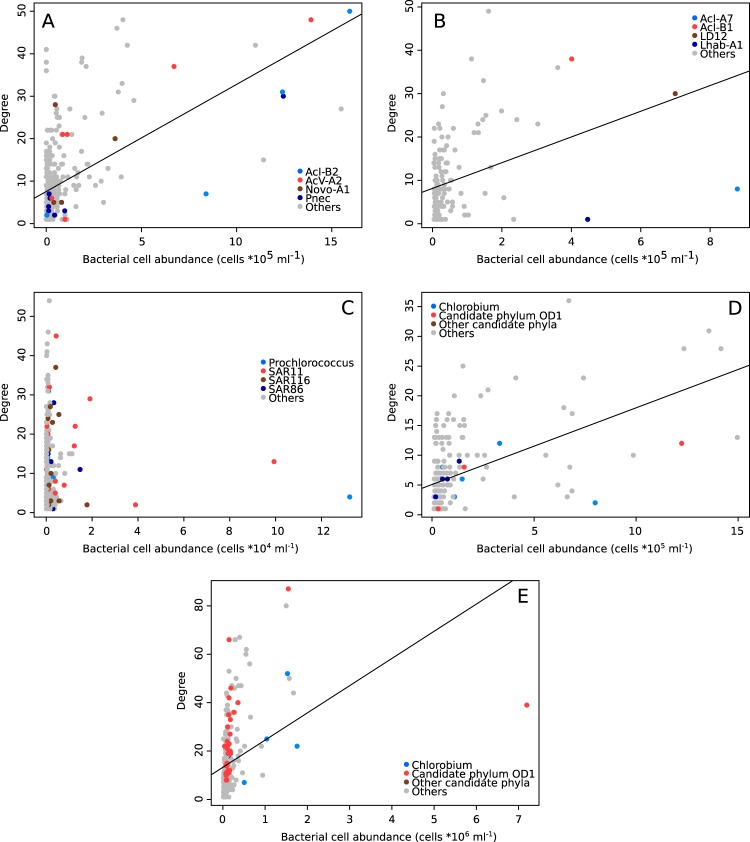
FIG 1.
Relationship between the number of edges and abundance for each node (taxon). Plots show the general linear models for the data sets collected from the epilimnion of Lake Alinen Mustajärvi (trophic data set) (A), Lake Erken (B), the Hawaiian Ocean Time (HOT) series (C), and the metalimnion (D) and hypolimnion (E) of Lake Alinen Mustajärvi. In panels A and B, bacterial tribes are defined as described by Newton et al. (51). In panel C, the most common marine alphaproteobacterial clades, SAR11 and SAR116, as well as the gammaproteobacterial clade SAR86, are highlighted.

