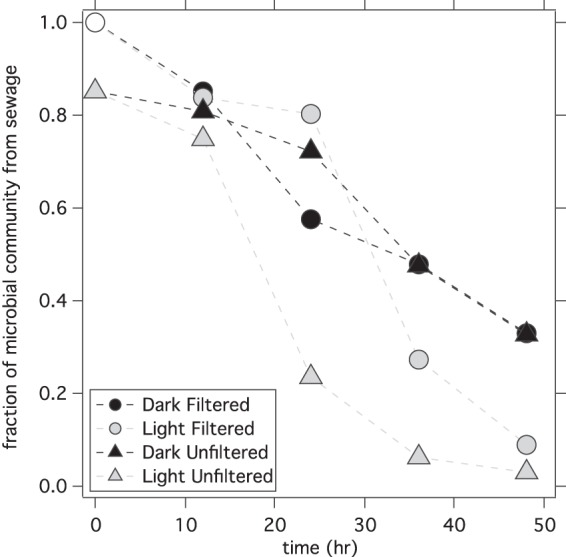
FIG 3.

Changes in the proportion of the sewage microbial community with time. The open circle at 1.0 represents the assumed fraction of the microbial community from sewage in the filtered-seawater-plus-sewage mixture at 0 h. The fraction of the microbial community from sewage in the unfiltered-seawater-plus-sewage mixture at 0 h is less than 1 because the community contains microorganisms from both sewage and seawater. Time since the start of the experiment is shown on the x axis.
