
Figure 3. Taxonomic classification of unaligned reads reveals presence of potentially-legitimate reads as well as contaminant sequences.
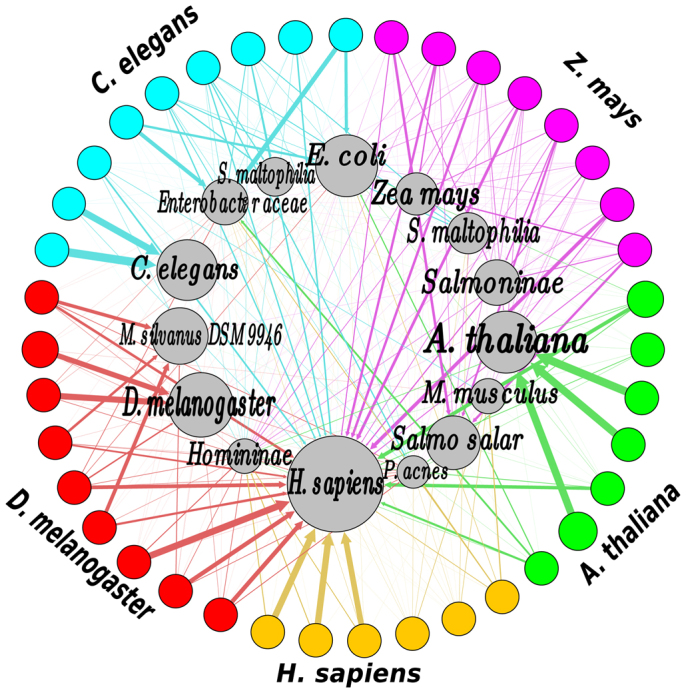
Inner circles represent taxonomic units, sizes reflect relative abundance of the taxonomically-classified reads in each unaliged ChIP-Seq dataset; outer circles represent unaligned ChIP-Seq datasets; edge thickness corresponds to the proportion of reads assigned to the corresponding taxonomic unit.