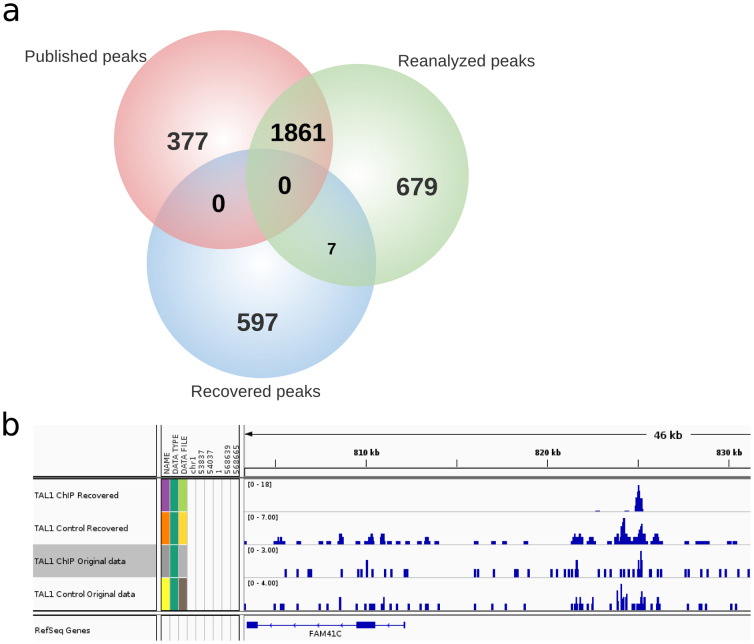
Figure 5.
Venn diagram representation of overlap of published, reanalyzed and recovered peaks (a). Peak representation for a novel TAL1 binding site found by reanalysis of previously unaligned reads (b). ‘TAL1 ChIP Recovered’ and ‘TAL1 Control Recovered’ denote the ChIP and control tracks for the recovered peaks respectively; ‘TAL1 ChIP Original data’ and ‘TAL1 Control Original data’ denote the respective ChIP and control of the original TAL1 ChIP-Seq data before read recovery.

