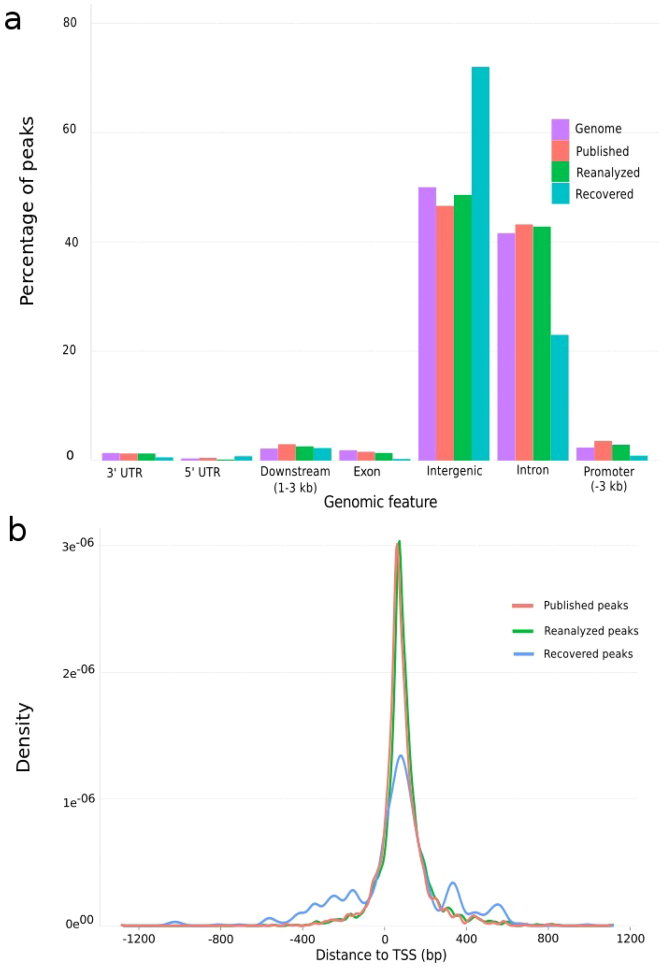
Figure 7. Peak distribution.
(a) TAL1 binding regions relative to the human genome structure (purple color): Proportions of peaks were determined in genomic components of 3′ untranslated region (UTR), 5′ UTR, downstream, exon, intergenic, intron and promoter in published (red), reanalyzed (green) and recovered (blue) datasets. (b) Peak density relative to TSS: Kernel density distribution of peaks from the three categories of datasets exhibited a local enrichment around TSS.

