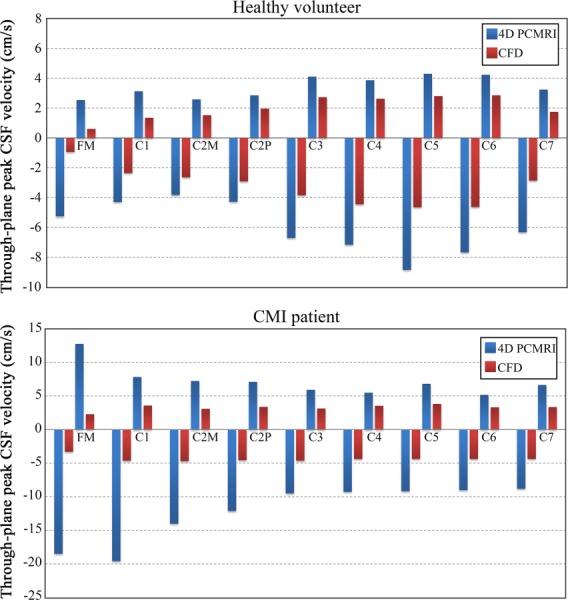
Fig. 3.

Comparison of peak systolic (negative values) and peak diastolic (positive values) CSF velocities along the cervical spine between 4D PCMRI and CFD for the healthy volunteer (top) and CMI patient (bottom). Peak systolic and peak diastolic velocities were defined as the maximum magnitude of through-plane velocities that occurred anywhere within the designated cross sections at the time points corresponding to peak systole and peak diastole, respectively.
