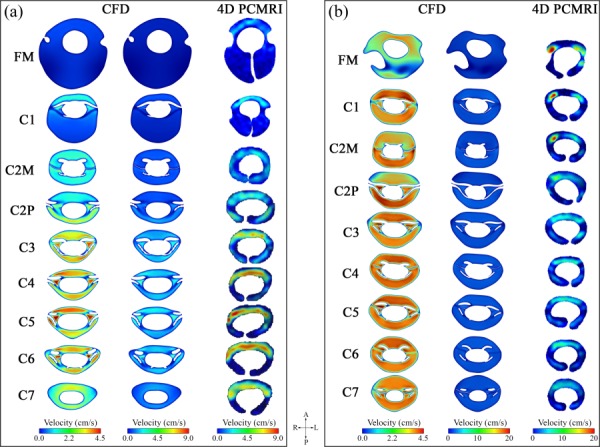
Fig. 4.

Distribution of through-plane peak systolic velocity magnitude at different locations along the cervical spine plotted (a) for the healthy case and (b) for the CMI patient. In each set of contours, the left and right column represents the results obtained from the CFD simulation and 4D PCMRI measurements, respectively. Note: CFD results are shown in two columns; one with a velocity range identical to 4D PCMRI and another with a smaller velocity range to show detail in the CFD velocity profiles.
