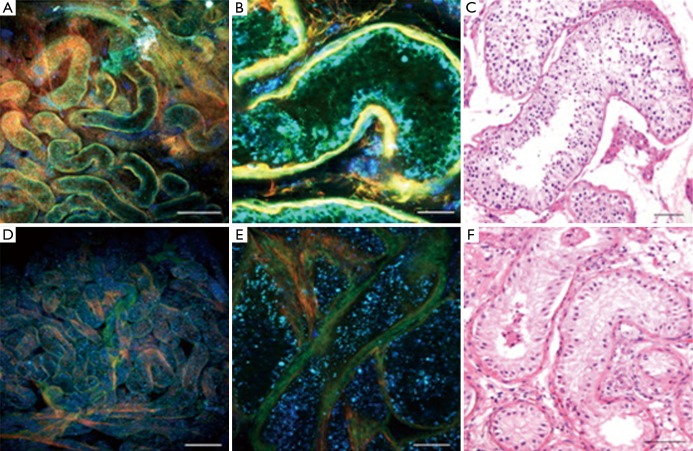
Figure 1.
Seminiferous tubular histology patterns imaged by multiphoton microscopy (MPM) at low (A and D) and high (B and E) magnification compared to high magnification stained tissue (C and F). Normal spermatogenesis is shown by green areas in A to C and seminiferous tubules with Sertoli-cell only pathology is shown by blue areas in D to F. Hematoxylin and eosin (H&E) (C and F). Scale bar represents 500 µm (A and D) and 80 µm (B, C, E and F) (14).

