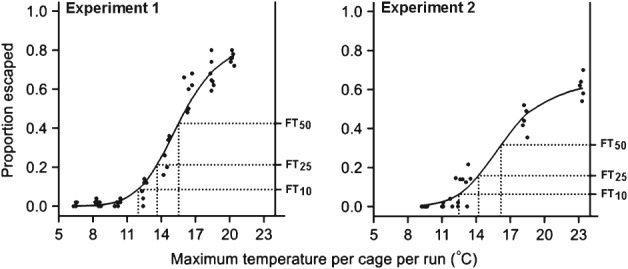
Figure 2.

Fitted temperature–response models for flight bioassay experiments 1 and 2, indicating estimated flight threshold values FT10 [experiment 1, 12.0 °C, 95% confidence limits (CL) 11.5, 12.4; experiment 2, 12.5 °C, 95% CL 11.8, 13.2), FT25 (experiment 1, 13.6 °C, 95% CL 13.1, 14.2; experiment 2, 14.2 °C, 95% CL 13.4, 15.1) and FT50 (experiment 1, 15.5 °C, 95% CL 14.8, 16.4; experiment 2, 16.2 °C, 95% CL 15.2, 17.5). All axes and FT estimates are back-transformed from the log10 scale to the natural scale. Escape from the release point was taken as evidence of a propensity to fly. Filled circles represent the observed data, i.e. the proportion of pollen beetles in each cage that escaped the release point, plotted against the maximum temperature recorded in the cage during the run (N = 56 runs for experiment 1 and 30 runs for experiment 2).
