Figure 1.
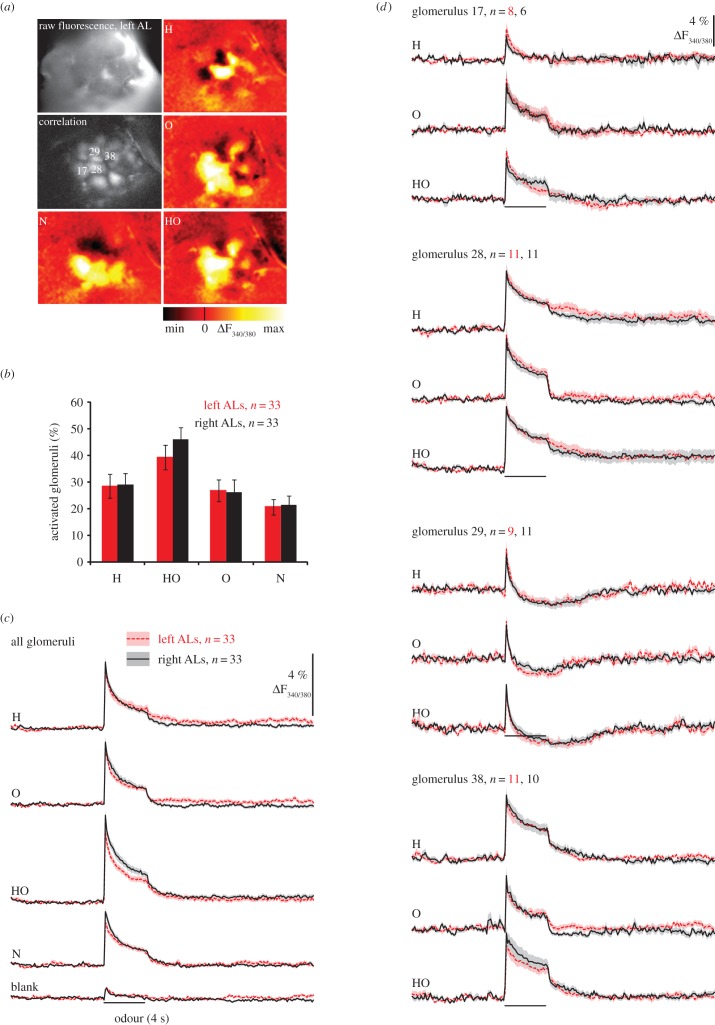
PN response strength does not differ between sides. (a) Calcium imaging in PNs (raw fluorescence, left AL), correlation image of the same AL (correlation) with identified glomeruli whose odour responses is represented in (d)) and colour-coded images showing odour-evoked glomerular activity to 2-nonanol (N), 1-hexanol (H), 2-octanol (O) and a 1 : 1 mixture of 1-hexanol and 2-octanol (HO). (b) The number of odour-activated glomeruli is equal between sides. Percentage of activated glomeruli for different odour stimuli: each glomerulus was considered active when activity during the first second of odour response showed a signal greater than or equal to 6 × s.d. before stimulus onset. For each bee, the percentage of activated glomeruli was calculated as mean ± s.e.m. for left and right ALs (N = 33 per side). The percentage of activated glomeruli differed between odours (F3,192 = 23.436, p < 0.001) but not between sides (F1,64 = 0.143, p = 0.706) and there was no interaction between side and type of odourant (odour × side F3,192 = 0.706, p = 0.529). (c) Time course of global PN responses to odours along the whole recordings (29 s) (average over all glomeruli; mean ± s.e.m.); grey bars indicate the 4 s stimulus pulse. The RM ANOVA revealed an odour effect (F3,192 = 25.57, p < 0.001) but neither side effect (side F1,64 = 2.59; p = 0.112) nor interactions (odour × side F3,19 = 1.390; p = 0.25) were found. (d) Time course of PN responses to odours in identified glomeruli averaged across animals. (Online version in colour.)

