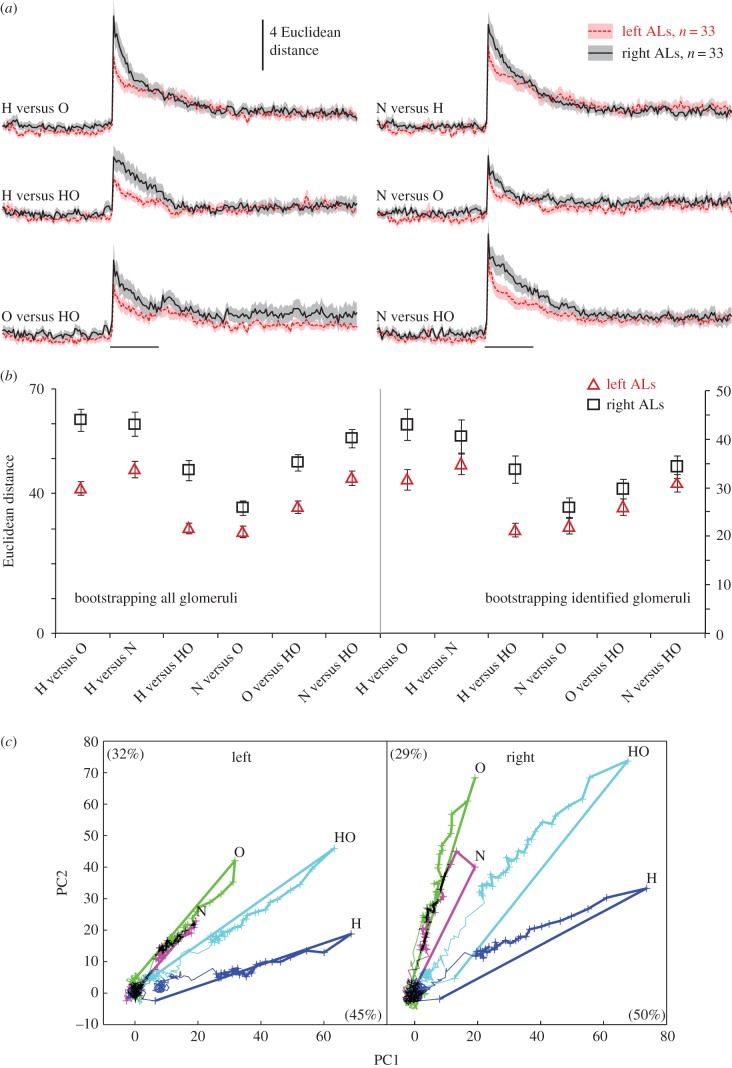
Figure 2.
Distances between odour response patterns are greater in the right AL. (a) Time course of Euclidean distances between odourant pairs across all glomeruli (average over all bees; mean ± s.e.m.) in left ALs (red online) and right ALs (black) ALs. The horizontal bars indicate the 4 s stimulus pulse. (b) Left graph: bootstrapping distributions of Euclidean distances (mean ± s.d.) in left and right ALs from 10 000 random samples with replacements within the pooled left and right AL data (balanced to 426 glomeruli within each group). Means of Euclidean distances are calculated over the first second of odour stimuli. Right graph: same as left graph but pooling the identified glomeruli only (158 glomeruli per side). (c) Trajectories of the odour responses in all glomeruli of left ALs (426 glomeruli) and right ALs (455 glomeruli) calculated using PCA. Bold lines indicate the 4 s odour stimulation. Crosses represent the time points of sampled frames during odour stimulation (125 ms inter-frame interval). Percentages of variability explained by PC1 and PC2 are given in brackets. H: 1-hexanol; O: 2-octanol; N: 2-nonanol; HO: 1 : 1 mixture of 1-hexanol and 2-octanol. (Online version in colour.)

