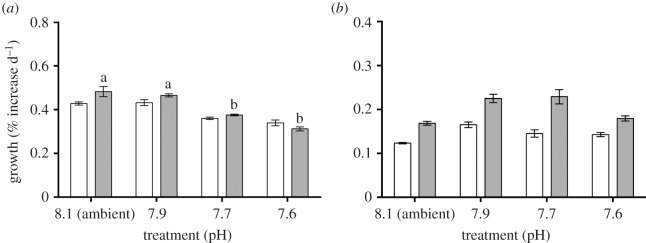
Figure 1.

Growth rates expressed as surface area (white bars) and buoyant weight (grey bars) of (a) A. lessonii and (b) M. vertebralis in the 30 day experiment. Data are expressed as mean ± s.e. (n = 12). Different letters indicate statistically significant differences (Tukey's HSD test; p < 0.05) in mean values among experimental groups of individuals. Upper and lower bars indicate standard error of the mean.
