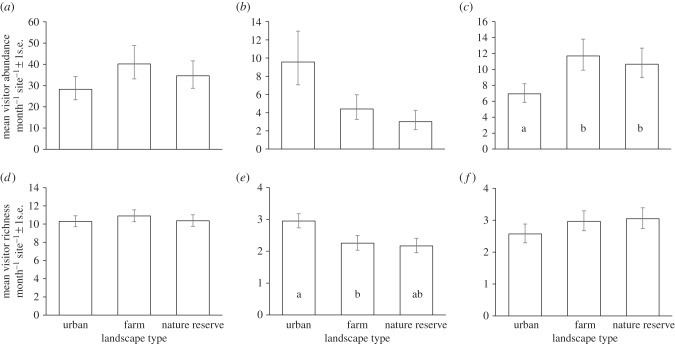
Figure 1.
Mean (a–c) flower-visitor abundance and (d–f) visitor species richness per month per site ± 1 s.e. across the 12 cities for the three landscape types (urban, farmland and nature reserves). Landscape types significantly different from one another are indicated by different letters. Marginal (adjusted) means from the GLMMs, back-transformed to the original scale, are plotted, with standard errors based on the posterior distributions of the regression coefficients using a simulation approach implemented with the R package arm [43]. Results are shown for (a,d) all visitors combined, (b,e) bees and (c,f) hoverflies. Full GLMM results for all taxa are given in table 1.

