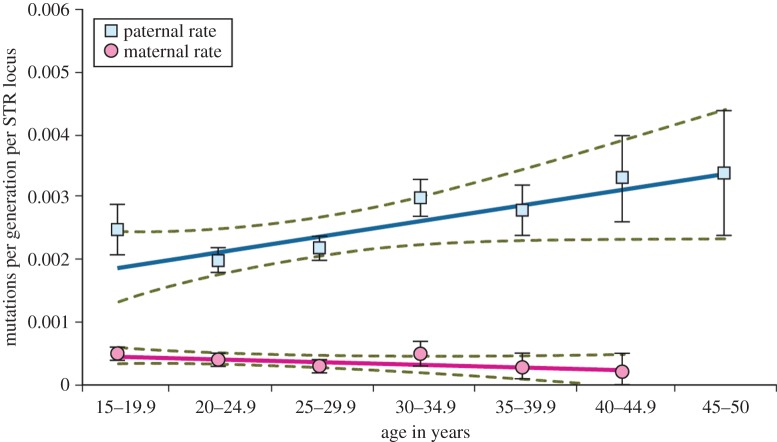
Figure 2.
Germline STR mutation rates for fathers (blue) and mothers (pink). Ages refer to the parent's age at conception, starting with 15 years and ending with 45 years for mothers and 50 years for fathers. The straight lines are linear regressions and the accompanying green lines are the 95% confidence intervals (CIs). Standard deviations for individual values are shown as bars. The graph is based on 325 paternal mutations determined from 142 354 meioses, and on 58 maternal mutations determined from 154 368 meioses.

