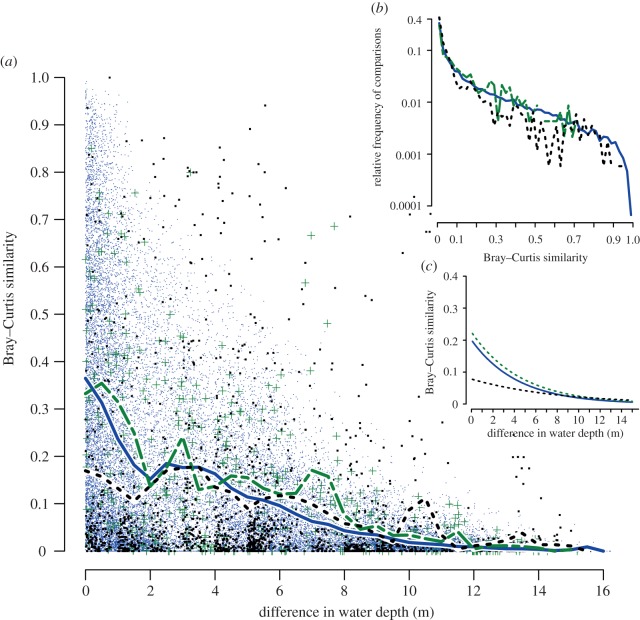
Figure 3.
Community turnover along a bathymetric gradient based on pairwise comparisons of samples with n ≥ 20. (a) Pairwise comparisons of samples (n ≥ 20) using Bray–Curtis similarity. The x-axis represents a difference in water depth between a given pair of compared samples. For core data (Holocene and Late Pleistocene) sample water depth was estimated using indirect multivariate ordinations calibrated a posteriori using present-day bathymetric distribution of common species [23]. For Modern samples, water depth was estimated directly at the time of sampling. Small blue dots mark within-Holocene pairwise comparisons, green crosses mark within-Late Pleistocene comparisons and large black dots mark within-Modern sample pairs. Thick lines represent mean Bray–Curtis values binned at 0.1 m depth intervals (Late Pleistocene—solid green line; Holocene—variably dashed blue line; Modern—short-dashed black line). (b) Decay-distance exponential models estimating turnover rates for within-Holocene, within-Late Pleistocene and within-Modern comparisons. (c) Comparison of relative frequency distributions of Bray–Curtis values for three types of comparisons (data binned at 0.02 intervals). y-axis is log-transformed. Small samples and rare taxa were excluded from all analyses.

