
Figure 1.
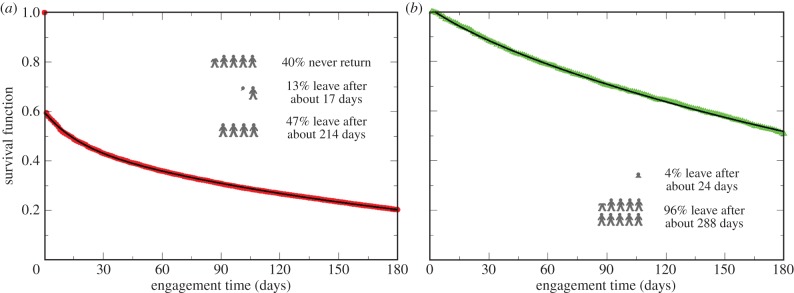
Cumulative distribution of engagement time for all unique identifiers in the database (a) and for programme members with at least one friend (b), and their corresponding fits to a linear superposition of exponentials (Y = 0.47exp(−t/214) + 0.13exp(−t/17) and Y = 0.96exp(−t/288) + 0.04exp(−t/24), respectively). We defined engagement time as the number of days between signing up to the programme and the last day of recorded activity. We restrict the plotting to 180 days because our study focuses on that period of time. Note the extraordinarily good agreement between data (red or green symbols) and fit (black line). (Online version in colour.)