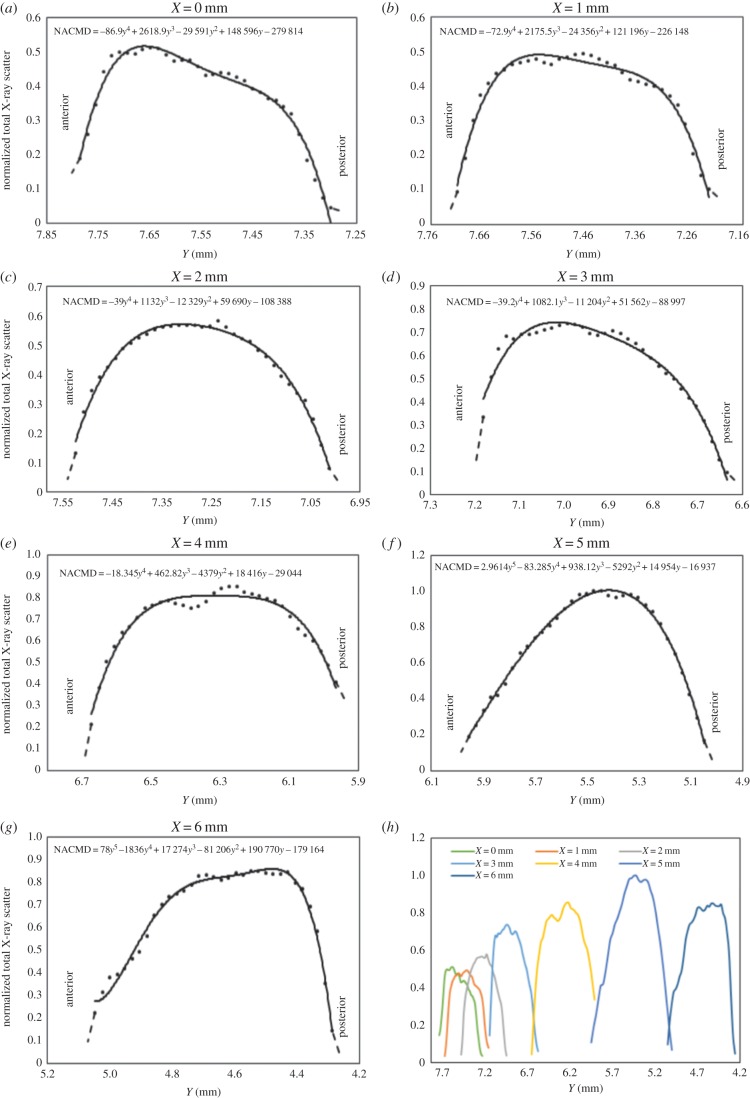
Figure 10.
Normalized average total X-ray scatter intensity (representing the normalized average corneal mass density, NACMD) shown as a function of tissue depth at specific radial positions across the central cornea (a–c) and temporal aspect of the peripheral cornea (d,e), limbus (f) and near sclera (g). The total X-ray scatter at each position in an individual scan was normalized against the maximum value of all the scans shown. Owing to possible edge effects in the first and last data points, these parts of the curves are shown by broken lines. Data from (a–g) are combined in (h) to allow a quantitative comparison of the normalized total X-ray scatter as a function of tissue depth at the different positions across the cornea and limbus.

