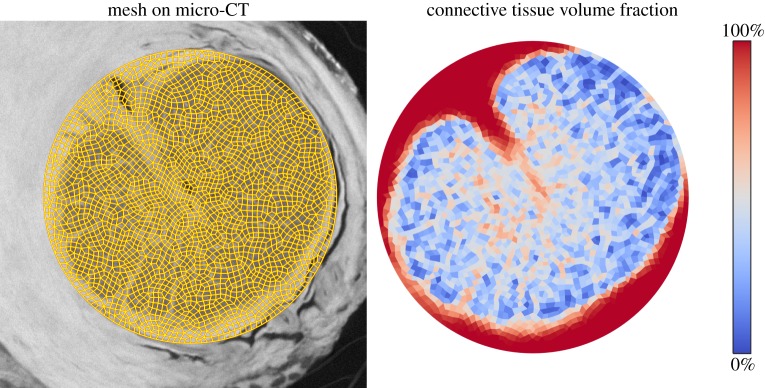
Figure 4.

Determination of tissue volume fraction. The finite-element mesh of the LC (figure 3, magenta region) was registered to the micro-CT image stack (eye A, left). Based upon segmentation using Frangi's filter, we computed the local tissue volume fraction on an element-by-element basis (right). All tissue in the LC was assumed to be either connective or neural tissue.
