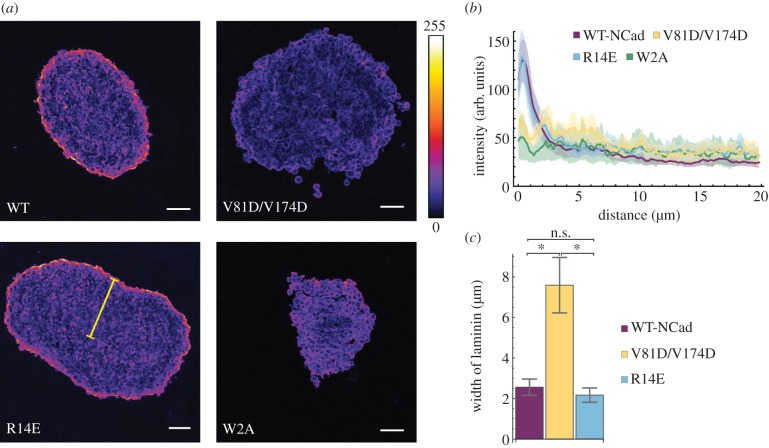
Figure 6.
Laminin intensity around spheroids. (a) Example images for laminin stained cryo-sections of 72 h old spheroids formed by seeding 2000 cells. Microscope: LSM780; objective lens: CZ 20×/N.A. 0.8; ex: 561 nm; em: 565–630 nm; scale bars: 50 µm. (b) Intensity profile of laminin along a line from the edge of the spheroid section to the centre for L cells expressing WT-N-cadherin or one of the cadherin mutants (V81D/V174D, R14E or W2A). In (a) an example of such a line is shown in yellow. For details of the analysis, see Material and methods. Mean ± s.e.m. are shown. (c) Bars show the mean distance (±s.e.m.) from the edge of a spheroid section to the location at which the laminin intensity dropped by 60% of its maximum value. For details of the analysis, see Material and methods. Asterisks indicate significant differences (*p < 0.05). The details of the test are provided in the Material and methods. In (b,c), the number of spheroids n are WT-N-Cad: n = 8; V81D/V174D: n = 6; R14E: n = 7; W2A: n = 5.

