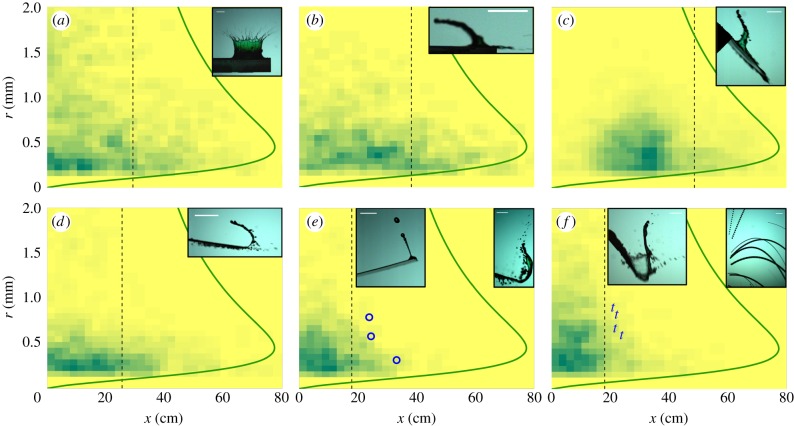
Figure 6.
Pathogen footprint. Probability distribution functions of ejected droplets for different substrates (table 1, a = (*), b = (·), c = (×), d = (□), e = (○), f = (t)). Shades of green (grey in print) quantify the likelihood of deposition of an ejected droplet of size r to reach a horizontal distance x from the leaf. The green (grey in print) solid line is the substrate-independent limit xm(r) resulting from We ≤ 50. Additional symbols (e,f) mark the position of the furthest reaching inertial detachment droplets. The vertical dashed line represents the distance x* past which only 10% of the total ejected volume is identified. (Online version in colour.)

