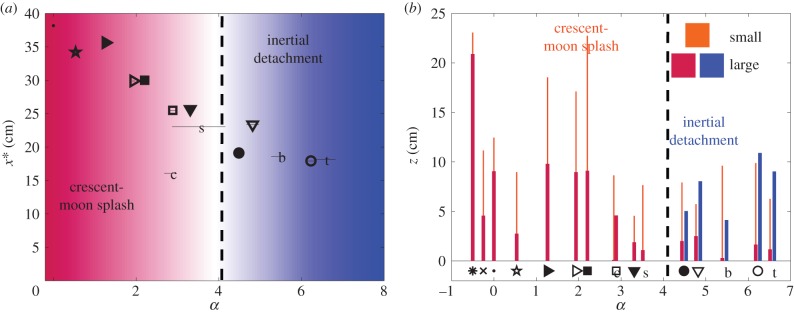
Figure 9.

Compliance impacts dispersal. (a) Variation of x* with respect to the compliance parameter α. (b) Ejection height z of the droplets as a function of α. Thick (thin) lines indicate the maximum distance upwards reached by large (small) ejected droplets. In both (a,b), symbols refer to substrates as described in table 1. Blue shades correspond to inertial detachment while red shades correspond to crescent-moon splash. The dashed line indicates the value of α beyond which inertial detachment is observed.
