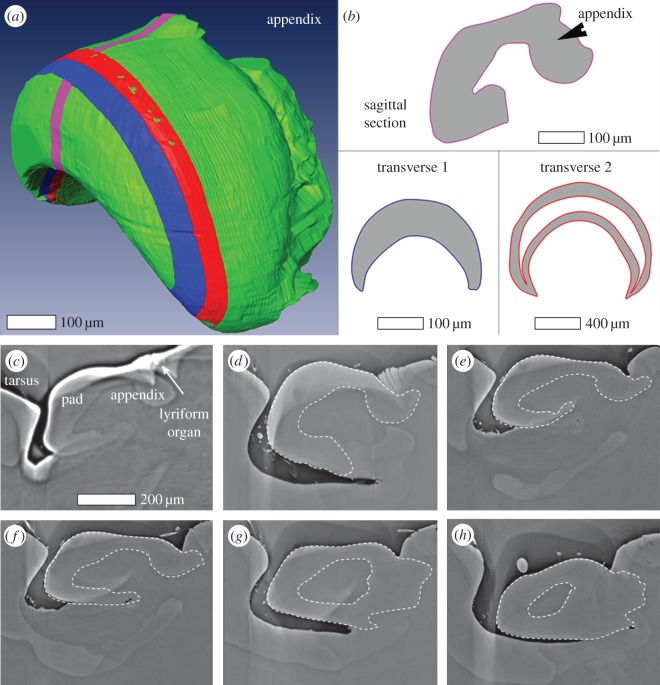
Figure 2.
(a) Surface rendering of the reconstructed µCT data of the pad. Virtual sections representing sample sections used in this study are indicated by three differently coloured slices: pink, blue and red (b) Schematic of the shape for the slices shown in (a). (c–h) µCT virtual slices along the long axis of the leg (sagittal plane) laterally extending from the pad centre (c) to the pad lateral edge (h). The dashed lines show the outline of the pad traced along the organ. The line was determined using a number of successive images.

