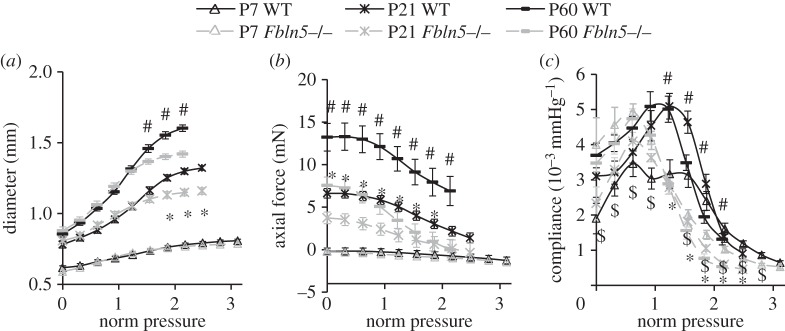
Figure 2.

Normalized (norm) pressure versus outer diameter (a), axial force (b) and compliance (c) of the ascending aorta in WT and Fbln5−/− aorta throughout early maturation. A normalized pressure = 1 represents the mean physiologic pressure for each age and genotype [20]. Data were obtained from ex vivo mechanical tests with the aorta held near the in vivo axial stretch ratio. N = 8–13 for each group. ‘$’ denotes p ≤ 0.05 at P7, ‘*’ denotes p ≤ 0.05 at P21 and ‘#’ denotes p ≤ 0.05 at P60 for Fbln5−/− compared to WT.
