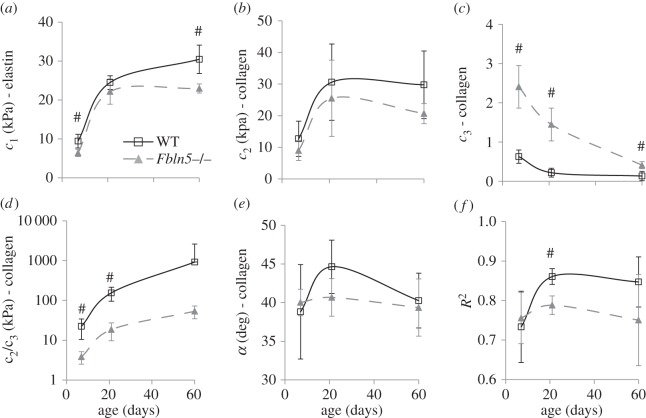
Figure 5.
Average fitted constants (a–e) and goodness of fit (R2) (f) for the constitutive model used to describe biaxial mechanical behaviour of WT and Fbln5−/− aorta throughout early maturation. Only those aortae with six successful mechanical test protocols (three inflation protocols at constant axial stretch and three axial stretch protocols at constant pressure) were included in the constitutive modelling. Note that (d) is plotted on a log scale. N = 5–8 per group. ‘#’ denotes p ≤ 0.05 for Fbln5−/− compared to WT.

