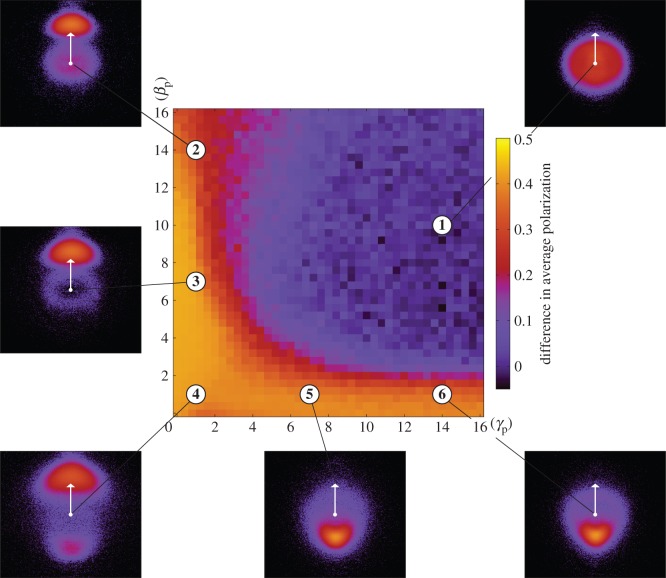
Figure 3.
Each data point represents the difference in the average polarization caused by a single perturbing fish, while varying its attraction (γp) and alignment (βp) parameters, in comparison to the unperturbed case located in the transition region (γm = 14, βm = 10). The six insets shown here represent the location distribution of the positions of the perturbing fish in relation to the group's centroid (white circle), and reoriented according to the average direction movement of the group (white arrow).

