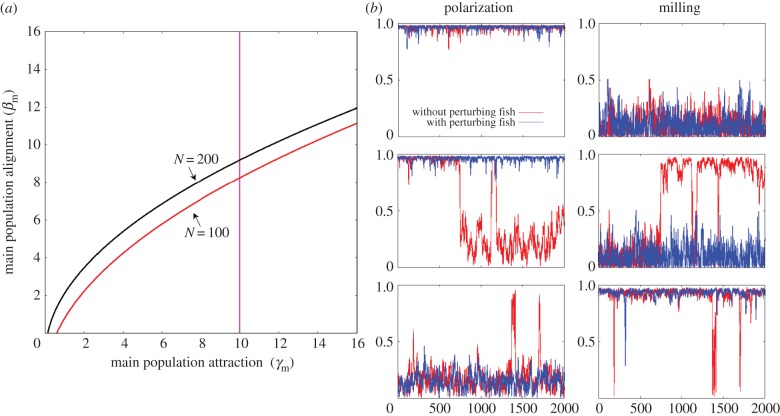
Figure 4.
(a) Transition functions between schooling and milling fitted for simulations with 100 and 200 fish  , where [A = 3.22, B = −2.23] for 100 fish and [A = 3.28, B = −1.17] for 200 fish. (b) Time series of polarization P and M milling parameters when the main population is in three different states: schooling (γm = 4, βm = 14), milling (γm = 14, βm = 4) and the transition between both states (γm = 14, βm = 10), for unperturbed condition (red line) and with a single perturbing fish introduced in the group (blue line, γp = 10, βp = 1).

