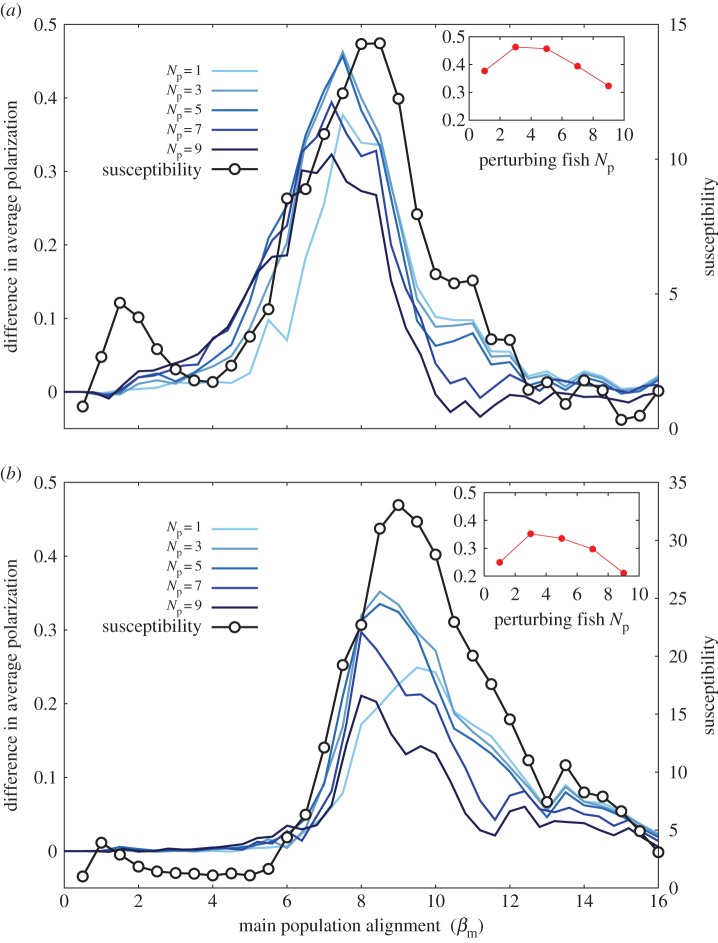
Figure 5.
Difference in the average polarization (left axis) in groups of 100 (a) and 200 (b) fish, with 1, 3, 5, 7 and 9 (light to dark blue) perturbing fish (γp = 14, βp = 1), as a function of the alignment parameter of the main population (βm[0,16]), keeping the attraction parameter of the main population to a constant value (γm = 10). The black line represents the susceptibility values (right axis) for the unperturbed condition. The insets show the maximum difference in average polarization as a function of the number of perturbing fish.

