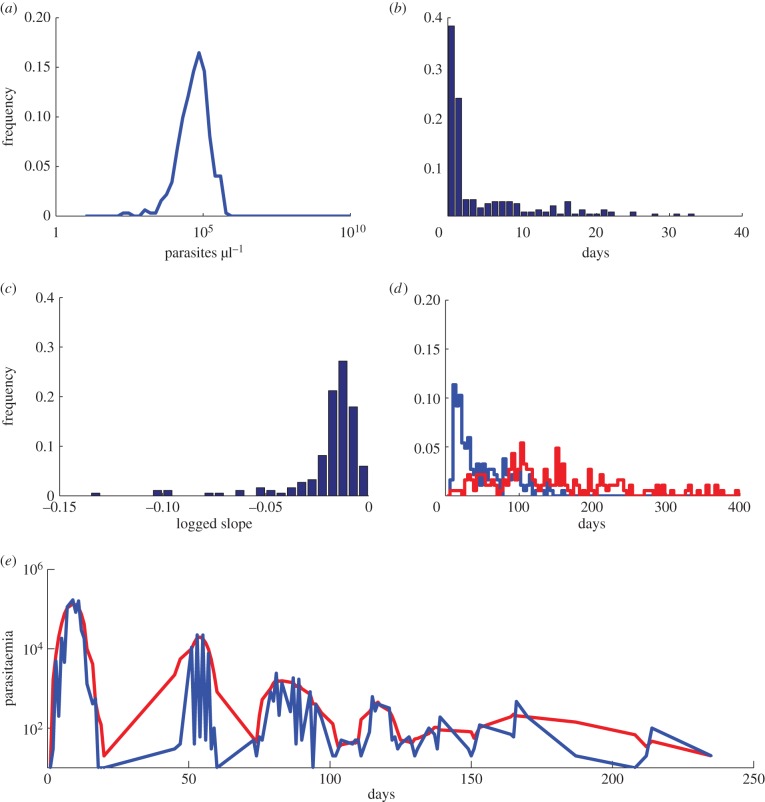
Figure 1.
Characteristics of P. falciparum dynamics in malaria therapy patients. (a) Histogram of the height of the initial peak in parasitaemia of malaria therapy patients. Many patients exhibit initial peak parasitaemia near 105 parasites per microlitre. (b) Histogram of the length of subpatent parasitaemia following the first peak in parasitaemia. More than 60% of untreated malaria therapy patients experience subpatent parasitaemia shortly following the initial parasitaemia peak, but the length of time subpatent ranges widely. (c) Histogram of the slope from the height of the initial peak in parasitaemia to the final patent parasitaemia on a log scale. Most patients show a similar logged slope that decays slowly. (d) Histogram of the day patients are first subpatent (blue) and the day they are last patent (red). Most patients have parasitaemia that drops below detectability long before the infection disappears. (e) Individual patient parasitaemia (representative patient shown by the blue line) exhibit short-time oscillations every 48 h and long-time ones on the order of weeks. The red line represents smoothed data with a moving average of 5 days. Data courtesy of Dr Collins and Dr Jeffrey.

