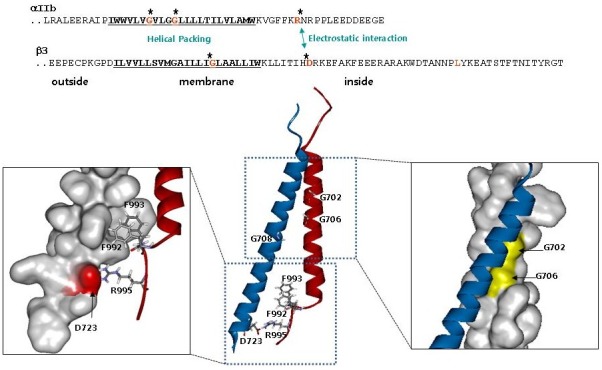
Fig. 1. Structure of integrin αIIbβ3 TMD (ribbon view; αIIb in red and β3 in blue. From PDB 2K9J) showing the two interaction interfaces. Right, outer membrane clasp (OMC) illustrating the helical packing involving αIIb Gly 702 and 706. Left, inner membrane clasp (IMC) showing the electrostatic interaction between αIIb Arg995 and β3 Asp723. Also depicted are the hydrophobic interactions of αIIb Phe992,933 with the β3 TMD. Adapted from reference (22).

