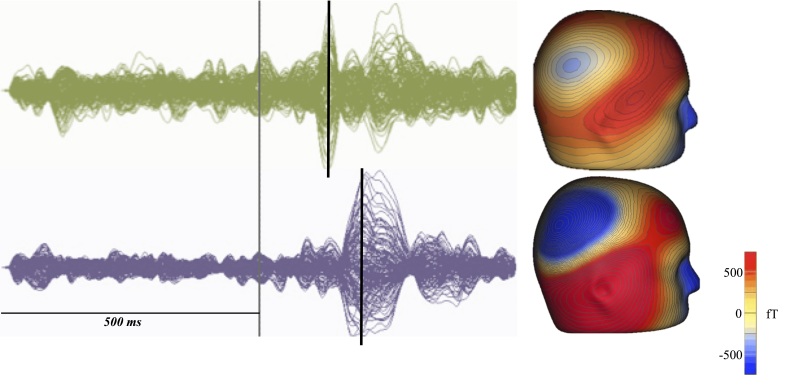
Figure 1.
Delayed M100 response latency in ASD, when compared to age matched typically developing controls. ASD (bottom) demonstrate a delay of the M100 response compared to typically developing controls (top) as detected by MEG. At left, ERP of typically developing (green) and children with ASD (purple), with stimulus marked in gray and M100 denoted by black bar. At right, 3D topographic representations of the M100 responses demonstrate that both populations M100 arise from the region of auditory cortex (top: TD; bottom: ASD).

