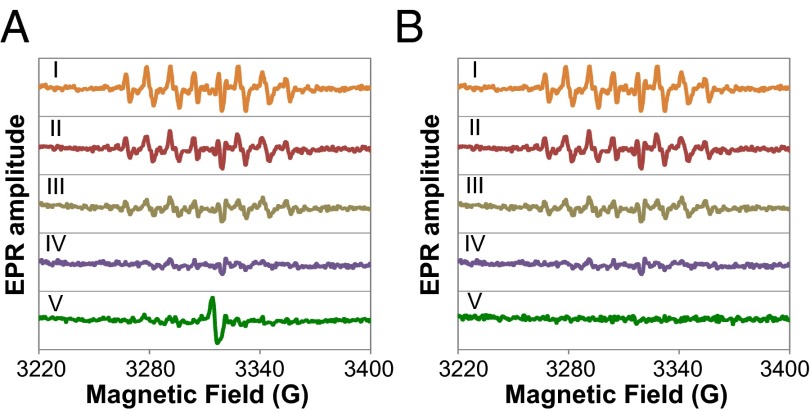
Fig. 2.
(A) Uncorrected and (B) corrected EPR spectra of the samples treated with SOD vs. PEG-HCCs. The dismutation of the O2•− radicals is being catalyzed by SOD1 causes a signal drop. (I) SOD1 0.01 U/mL. (II) SOD1 0.1 U/mL. (III) SOD1 1 U/mL. (IV) SOD1 10 U/mL. (V) PEG-HCCs (0.07 mg/mL or 170.1 nM, which is the same concentration used in Fig. 1A). The spectrum in B, V was corrected by subtracting the EPR signal of the starting PEG-HCCs.

