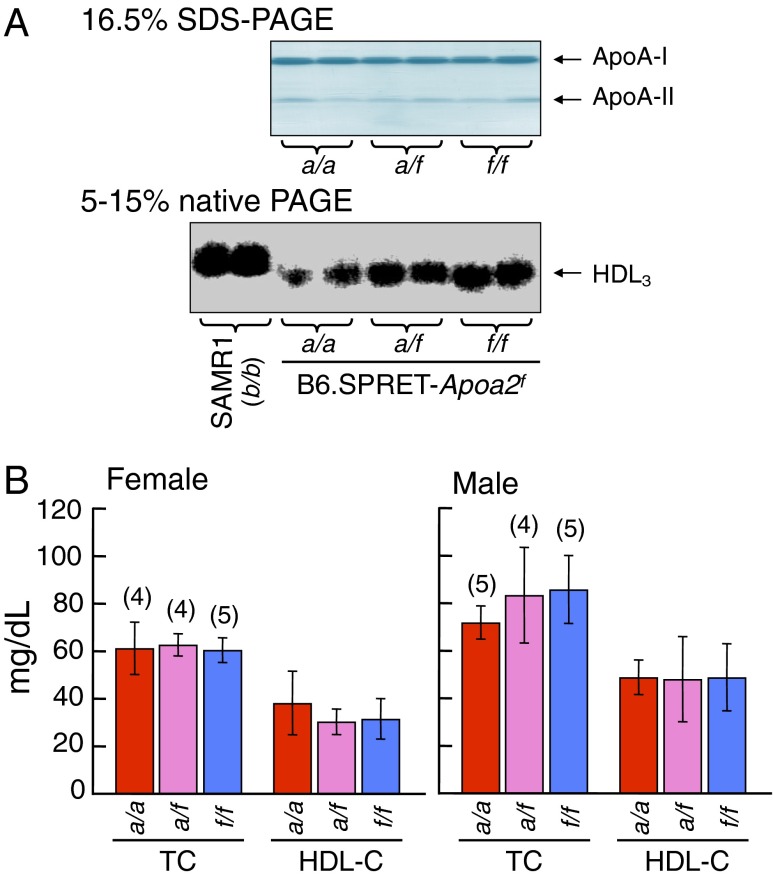
Fig. 3.
Plasma concentrations of apoAs and cholesterols in B6.SPRET-Apoa2f mice at 2 mo of age. (A, Upper) ApoA-I and apoA-II in the HDL fraction were detected by CBB staining. (Lower) HDL3 particles were visualized by Sudan Black B staining. SAMR1 strain was used as a control for comparison with the Apoa2f/f mice. (B) Concentrations of plasma total and HDL cholesterols (TC and HDL-C, respectively). Each column and bar represents the mean ± SD, and numbers in parentheses represent total mice examined. There were no significant differences among three groups in various pairwise comparisons (Tukey–Kramer method for multiple comparison).

