Fig. 5.

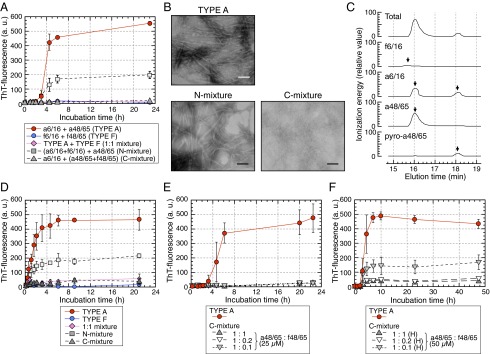
C-terminal APOA2F peptide inhibited the polymerization of APOA2A peptides in vitro. (A) ThT plots of APOA2A peptides mixed with APOA2F peptides. TYPE A, 50 µM each (a6/16 + a48/65); TYPE F, 50 µM each (f6/16 + f48/65); 1:1 mixture, 25 µM each (TYPE A + TYPE F); N-mixture, 25 µM each (a6/16 + f6/16) + 50 µM f48/65; C-mixture, 50 µM a6/16 + 25 µM each (a48/65 + f48/65). Each symbol and bar represents the mean ± SD (n = 3). a.u., arbitrary units. (B) TEM images of the mixtures after 23 h of incubation. (Scale bars: 100 nm.) (C) Representative LC-MS/MS analyses show profiles of the products of the N-mixture after 23 h of incubation. (D) Seed-dependent amyloid fibril extension of APOA2A and APOA2F peptides. In the presence of premade APOA2A fibrils, extension of TYPE A, TYPE F, or mixtures of APOA2A and APOA2F peptides were determined by ThT binding assay. Each symbol and bar represents the mean ± SD (n = 3). a.u., arbitrary units. (E and F) ThT plots of APOA2A peptides mixed with f48/65 at various concentrations. Concentrations of the a48/65 in the mixtures were 25 µM in E (n = 3) and 50 µM [high-concentration condition, (H)] in F (n = 4), and that of the a6/16 in each reaction mixture was 50 µM. Each symbol and bar represents the mean ± SD. a.u., arbitrary units.
