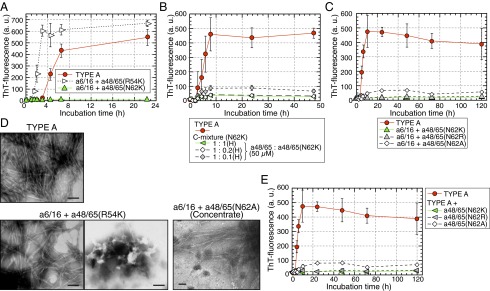
Fig. 6.

Single amino acid substitutions in the C-terminal sequence at position 62 of APOA2A inhibited the polymerization of amyloidogenic peptides. (A and C) ThT plots of the N-terminal APOA2A peptide plus a single amino acid substitution. Each concentration of peptides in the mixture was 50 µM. Each symbol and bar represents the mean ± SD (n = 3). a.u., arbitrary units. (B) ThT plots of APOA2A peptides mixed with a48/65(N62K) at various concentrations. Concentration of the a48/65 in the reaction mixtures was 50 µM similar to the experimental condition shown in Fig. 5F. Each symbol and bar represents the mean ± SD [n = 3 (TYPE A) and n = 4 (others)]. a.u., arbitrary units; H, high-concentration conditions. (E) ThT plots of APOA2A peptides mixed with a single amino acid substitution. The plot of TYPE A represents the same as in C because the experiments in C and E were performed at the same time. Each symbol and bar represents the mean ± SD (n = 3). a.u., arbitrary units. In C and E, the ThT intensities of the mixture using a48/65(N62A), but not a48/65(N62R), were higher compared with those of a48/65(N62K) after 10 h of incubation (P < 0.05, Student’s t test). (D) TEM images of the mixtures after 22.5 h of incubation shown in A. Because no characteristic form of amyloid fibrils was detected in the mixture of a6/16 + a48/65(N62A) after 120 h of incubation shown in C, the mixtures were concentrated ∼18-fold according to the method used to collect seeds. Only a few characteristic forms similar to fibrils derived from TYPE A in the concentrate were detected [a48/65(N62A) (Concentrate)]. (Scale bars: 100 nm.)
