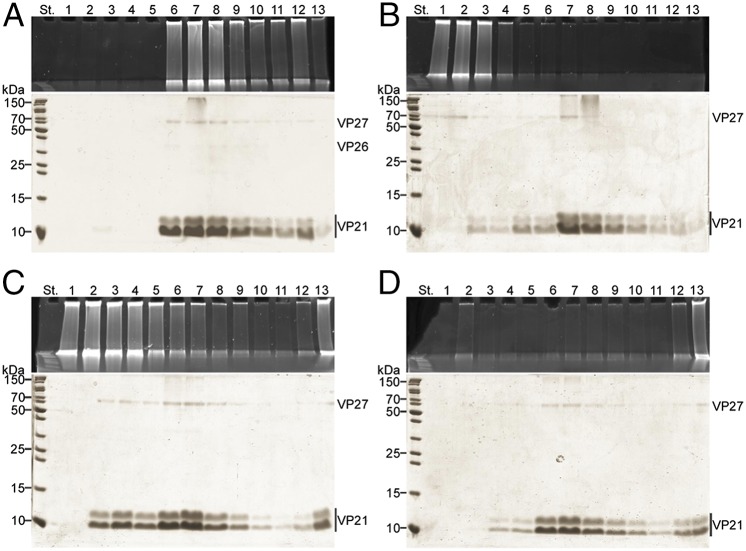
Fig. 2.
Production of empty tubes of His1. The virions and dissociation products were sedimented by rate zonal centrifugation, and the gradient fractions were analyzed for DNA and proteins by gel electrophoresis. Upper represents EtBr and Lower represents Coomassie blue staining of the SDS/PAGE gels (for nucleic acids and proteins, respectively). Numbers at the top indicate gradient fractions 1–13 starting from the surface of the gradient. Numbers on the left indicate the molecular mass markers. Centrifugation time was three times longer in B and C compared with the one used in A (Materials and Methods). (A) Untreated 2× purified virions. (B) Virions treated with 0.01% (vol/vol) Nonidet P-40 at low salinity at room temperature for 90 min. (C) Virions incubated at 80 °C at low salinity for 5 min. (D) Virions boiled at low salinity for 10 min.

